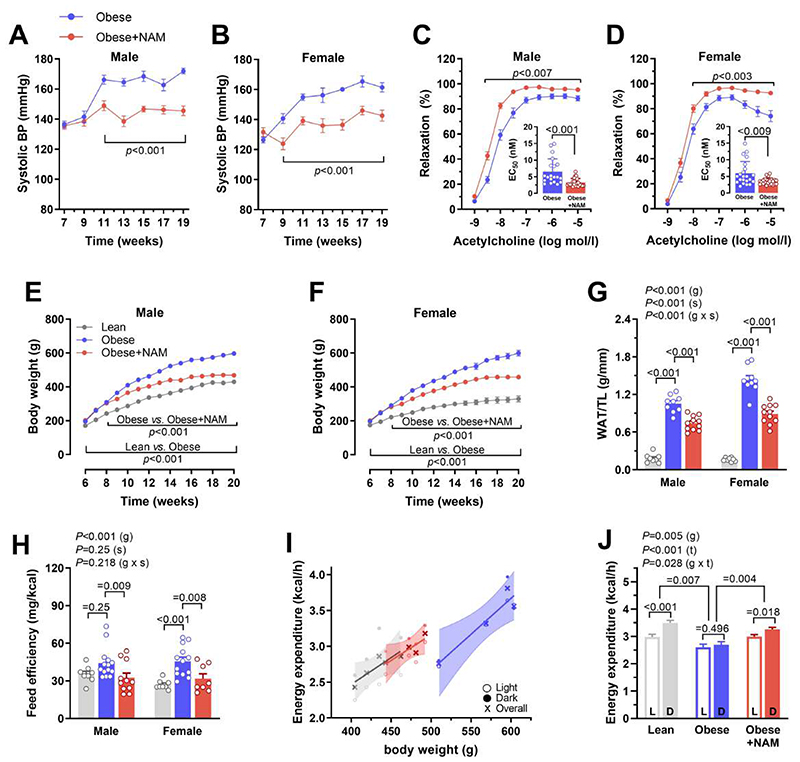
Fig. 2. NAM ameliorates blood pressure control and adiposity in ZSF1 obese rats.
(A and B) Systolic arterial blood pressure, non-invasively measured by the tail-cuff method, in (A) male and (B) female ZSF1 obese rats treated or not with nicotinamide (NAM) starting from 8 weeks. (n=10/11 and 9/11 rats in obese/obese+NAM in males and females, respectively). (C and D) Acetylcholine-induced vasodilation measured ex vivo in the aortic rings of (C) male and (D) female rats; Inset graphs denote corresponding EC50 of single rings, (n=20/24 and 22/23 rings obtained from 4 obese/obese+NAM in males and females, respectively). (E and F) Body weight gain of (E) male and (F) female ZSF1 obese rats and their lean controls, (n=8/9/11 and 10/9/11 rats in lean/obese/obese+NAM for males and females, respectively). (G) Visceral white adipose tissue (WAT) normalized to tibia length (TL), (n=8/9/11 rats for lean/obese/obese+NAM in either gender). (H) Feeding efficiency (body weight gain per consumed kcal energy) measured during the first 2-3 weeks of treatment before the obvious body weight difference thereafter, (n=8/14/11 and 8/13/8 rats in lean/obese/obese+NAM for males and females, respectively). (I) Energy expenditure (shown as a function of body weight) evaluated by indirect calorimetry, and (J) estimated energy expenditure (during dark and light cycles of the day) at a hypothetical equal body weight (490.6 g) in all groups as derived from corresponding analysis of covariance (ANCOVA), (n=4 male rats per group). L, light; D, dark. All results except in I and J were generated from 2 independent cohorts. (A to F) P values were calculated by two-way repeated measures ANOVA, followed by Bonferroni-corrected pairwise comparisons; (C and D) EC50 were compared by Mann-Whitney test. (G and H) Indicated P values on top of panels represent factor comparisons by a linear mixed model including sex (s) and group (g) as fixed factors and the cohort as a random factor, and following comparisons between different groups within respective sex are indicated by Bonferroni post-hoc tests. (J) Factorial ANCOVA was used including group (g) and time of the day (t; light vs. dark 12h cycles) as fixed factors and body weight as a covariate, followed by Bonferroni-corrected pairwise comparisons. Circles/Bars and error bars show means and SEM, respectively, with individual data points superimposed, except for (J) where the means and SEM were derived from ANCOVA and corresponding individual data points are shown in (I).

