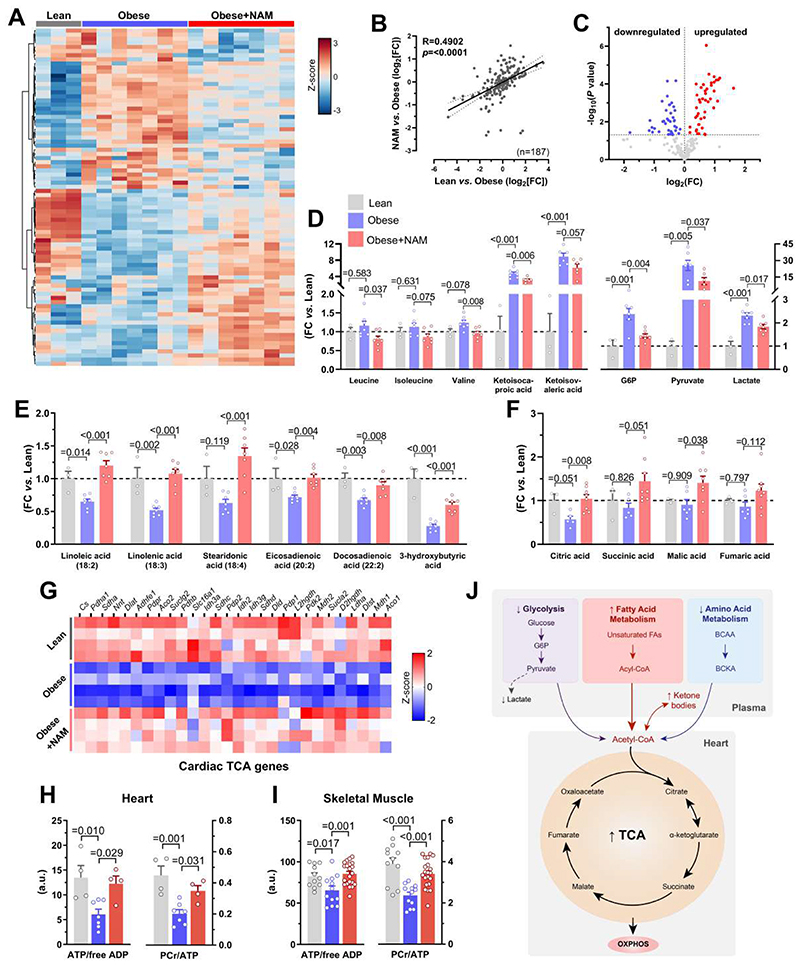
Fig. 3. NAM-mediated metabolic reprogramming improves energy homeostasis in HFpEF.
(A) Heatmap depicting relative abundance of significantly differentiated metabolites by nicotinamide (NAM) in the plasma of 12-week-old ZSF1 obese rats (4 weeks of NAM treatment) that were fasted for 6 hours, (n=3/7/7 rats in lean/obese/obese+NAM). (B) Correlation of NAM-induced metabolomic changes vs. the difference between ZSF1 lean and obese controls (Log2[fold-change, FC]). (C) Volcano plot showing up- and down-regulated metabolites of NAM-treated vs. control ZSF1 obese rats. (D and E) Relative difference in selected circulating metabolites related to (D) branched-chain amino acids metabolism (left) and glycolysis (right), as well as (E) lipolysis and ketogenesis (shown are polyunsaturated fatty acids and ketone bodies, please see also fig. S7 for other related metabolites), (n=3/7/7 rats in lean/obese/obese+NAM). (F) Relative abundance of tricarboxylic acid cycle (TCA) metabolites in left ventricular tissue of 20-week-old NAM-treated ZSF1 obese rats compared to age-matched obese and lean controls, (n=3/6/8 rats in lean/obese/obese+NAM). (G) Heatmaps of cardiac transcripts showing the expression (red=high, blue=low) of differentially regulated genes involved in TCA cycle in ZSF1 lean, obese and NAM-treated obese rats, (n=4 rats per group). (H and I) High-energy phosphate compounds in (H) the heart and (I) skeletal muscle (i.e., gastrocnemius) of ZSF1 rats, (n=4/7/4 and 11/12/21 rats in lean/obese/obese+NAM for heart and skeletal muscle, respectively). PCr, phosphocreatine; ATP, adenosine triphosphate; ADP, adenosine diphosphate. (J) Schematic representation of affected metabolic pathways by NAM supplementation. Abbreviations: BCAA, branched-chain amino acids; BCKA, branched-chain keto acids; G6P, glucose-6-phosphate. P values were calculated by (B) Pearson correlation, (C) Welch t-test or (D to F and H to I) ANOVA with Dunnett’s post-hoc test. Bars and error bars show means and SEM, respectively, with individual data points superimposed.

