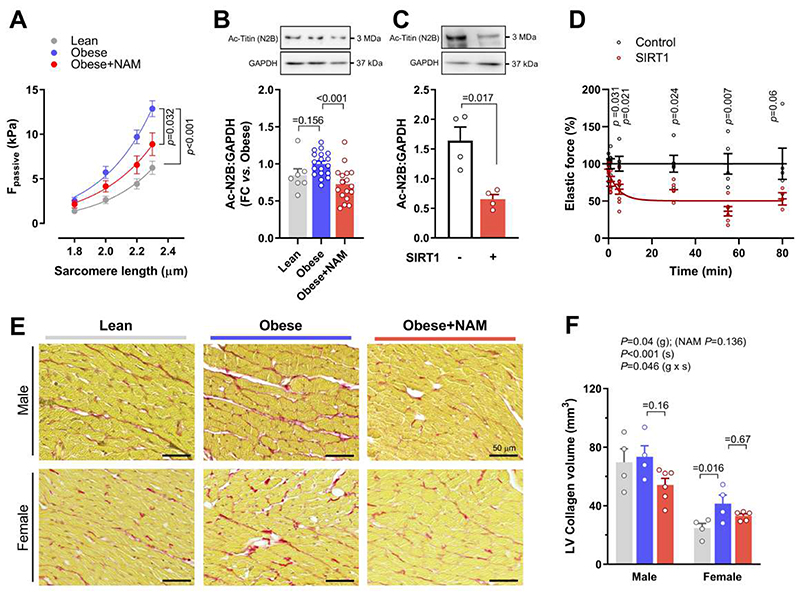
Fig. 5. Titin deacetylation is sufficient to improve cardiomyocyte passive stiffness.
(A) The relationship between passive force (Fpassive) and sarcomere length, indicative of passive stiffness, in skinned cardiomyocytes isolated from 20-week-old ZSF1 lean and obese rats treated or not with nicotinamide (NAM). Exponential curves are fitted to the group average (n=18/16/21 cardiomyocytes in lean/obese/obese+NAM isolated from 4/3/4 rats, respectively). (B and C) Representative Western blot (top) and quantification (bottom) of (B) cardiac titin acetylation (normalized to GAPDH) in 20-week-old ZSF1 rats, (n=7/18/17 rats in lean/obese/obese+NAM), (C) In vitro deacetylation of titin N2B isoform in skinned cardiomyocytes from healthy 20-week-old Wistar-Kyoto rats. Cells were incubated with recombinant SIRT1 for 2 hours at 30°C. Representative Western blot (top panels) probed with acetylated-lysine-specific antibodies for detection of total N2B acetylation; GAPDH antibody was used as a loading control. Lower panel shows quantification of titin-N2B acetylation normalized to GAPDH (N=4 rats per group). (D) Relative change in passive force of isolated skinned cardiomyocytes upon deacetylation with recombinant SIRT1 compared to control cells force that is measured in the same buffer but without SIRT1, (n=3-8 cardiomyocytes per condition and per time point). Data points are fitted using a one-phase decay curve fit. (E) Representative micrographs and (F) quantification of left ventricular (LV) fibrotic remodelling due to collagen accumulation, as evaluated by picrosirius red staining in 20-week-old male and female ZSF1 rats, (n=4/4/6 and 4/4/5 for lean/obese/obese+NAM in males and females, respectively). P values were calculated by (A) two-way repeated measures ANOVA with Dunnett’s post-hoc test, (B) ANOVA with Dunnett’s post-hoc test, (C and D) Welch’s t-test, or two-way independent ANOVA including group (g) and sex (s) as fixed factors with Bonferroni-corrected pairwise comparisons. Bars and error bars show means and SEM, respectively, with individual data points superimposed.

