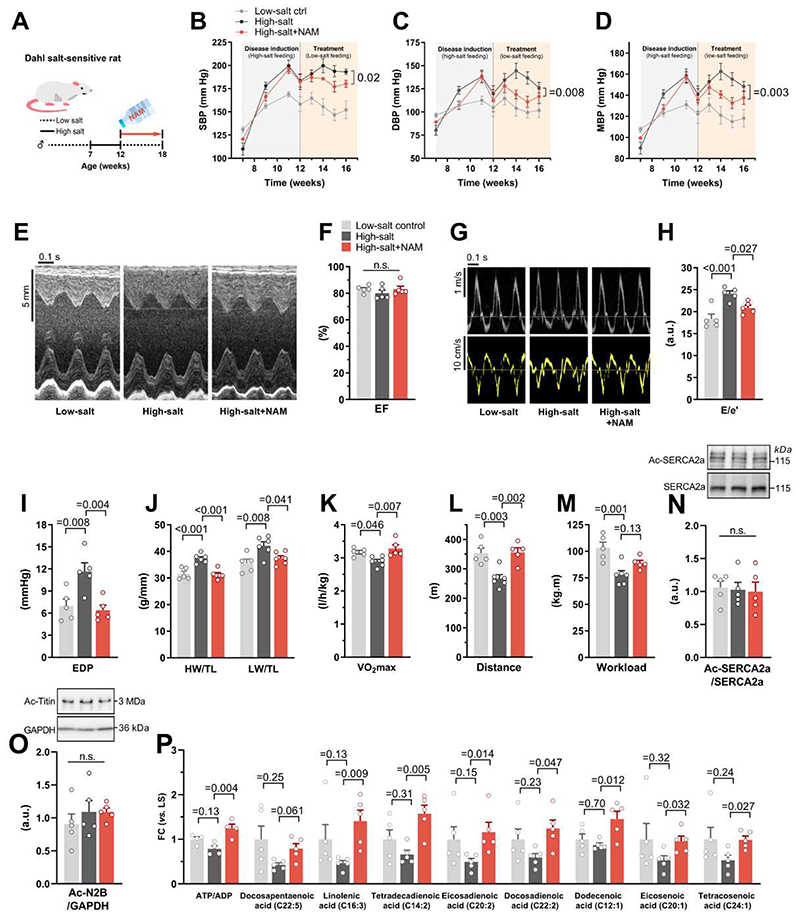
Fig. 6. NAM improves diastolic dysfunction in hypertensive Dahl rats.
(A) Schematic representation of nicotinamide (NAM) supplementation to hypertensive Dahl salt-sensitive rats. Seven-week-old male rats were fed a high-salt diet (8% NaCl) for 5 weeks followed by treatment in the form of a single intraperitoneal injection of furosemide (10 mg/kg body weight) and a shift to low-salt diet (0.3% NaCl) combined with 40 mM NAM in the drinking water (high-salt+NAM) or not (high-salt). Healthy controls were fed the low-salt diet throughout the experiment (low-salt ctrl). (B) Systolic, (C) diastolic and (D) mean arterial blood pressure, non-invasively measured by the tail-cuff method. (E) Representative echocardiography-derived M-mode tracings, (F) left ventricular ejection fraction (EF), (G) representative pulsed-wave Doppler (top) and tissue Doppler (bottom) tracings, and (H) ratio of peak early Doppler transmitral flow velocity (E) to myocardial tissue Doppler velocity (e’). (I) End-diastolic pressure (EDP) invasively measured by intracardiac catheterization. (J) Heart weight (HW; left) and lung weight (LW; right) normalized to tibia length (TL). (K) Maximal oxygen consumption (VO2max), (L) running distance, and (M) workload during exercise exhaustion testing. (N) Representative Western blot (top) and quantification (bottom) of cardiac SERCA2a acetylation (normalized to total SERCA2a expression), and (O) titin acetylation (normalized to GAPDH). (P) Relative abundance of cardiac unsaturated fatty acids differentially regulated by NAM in 18-week-old Dahl salt-sensitive rats, (n=4-6 rats per group). P values were calculated by (B to D) factorial repeated measures ANOVA (including age and groups as fixed factors) followed by Games-Howell post-hoc test or (F and H to P) ANOVA with Dunnett’s post-hoc test. Bars/line and error bars show means and SEM, respectively, with individual data points superimposed.

