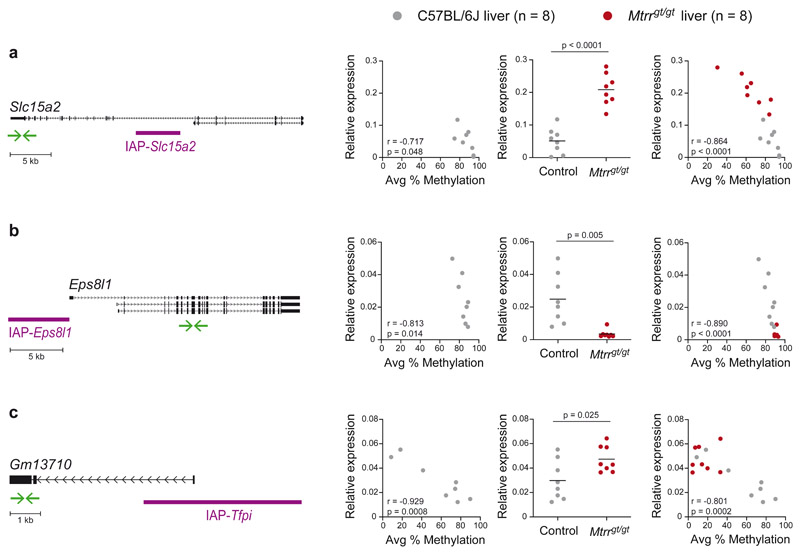
Fig. 5. VM-IAP-associated gene expression is altered in Mtrrgt/gt mice.
Left-hand graphs assess the correlation between VM-IAP methylation and adjacent Slc15a2 (a), Eps8l1 (b), and Gm13710 (c) gene expression in C57BL/6J livers (n = 8, r: Pearson’s correlation coefficient; p: two-tailed P value associated with r). Centre graphs show qRT-PCR expression data of VM-IAP-neighboring genes Slc15a2 (a), Eps8l1 (b), and Gm13710 (c) in C57BL/6J (n = 8, grey circles) and Mtrrgt/gt (n = 8, red circles) liver. P values were calculated by two-tailed Welch’s t-tests (means shown as black lines). Right-hand graphs incorporate both control and Mtrrgt/gt data and assess the correlation between gene expression and VM-IAP methylation (n = 16, r: Pearson’s correlation coefficient; p: two-tailed P value associated with r). Relative expression was normalized to Hprt1 expression and calculated using the ΔCt method. Gene Diagrams of VM-IAPs in relation to their neighboring gene are depicted on the far left. Gene transcripts, extracted from the University of California, Santa Cruz (UCSC) Genome Browser72, are shown in black and VM-IAPs in purple. Green arrows represent the location of qRT-PCR primers. Diagrams are drawn to scale. See also Extended Data Figure 3.

