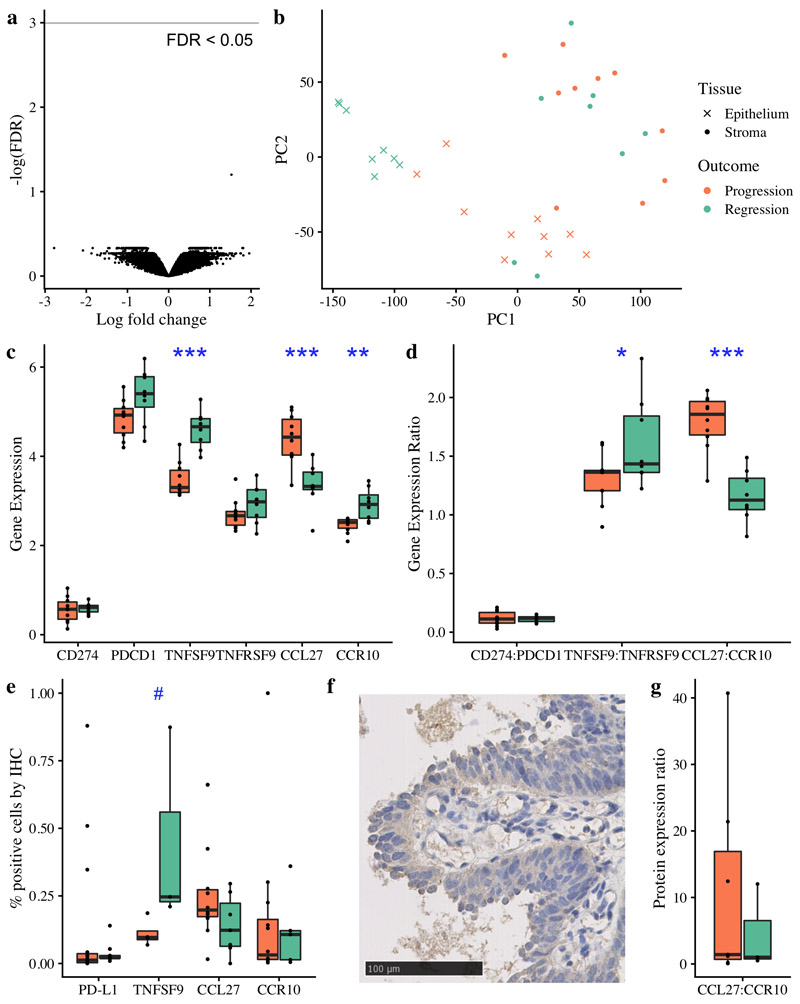
Figure 4. Immune escape mechanisms in CIS beyond antigen presentation.
(a) Volcano plot of gene expression differential analysis of laser-captured stroma comparing progressive (n=10) and regressive (n=8) CIS samples. No genes were significant with FDR < 0.05 following adjustment for multiple testing. (b) Principle component analysis plot of the same 18 CIS samples, showing laser-captured epithelium and matched stroma. (c-d) RNA analysis of immunomodulatory molecules and cytokine:receptor pairs in n=18 CIS samples identified TNFSF9 and CCL27:CCR10 as significantly differentially expressed between progressive and regressive samples (p=0.0000058 and p=0.0000019 respectively). (e) Immunohistochemistry showed that TNFSF9 was similarly differentially expressed at the protein level (p=0.057; n=7 with successful staining). (f) Illustrative immunohistochemistry staining for TNFSF9. CCL27 and CCR10 showed a similar trend at the protein level to the RNA level (e,g); whilst these data did not achieve a significance threshold (g; p=0.49 for CCL27:CCR10 ratio, n=10) we observe several outliers in the progressive group. Analysis of PD-L1 (encoded by CD274) and its receptor PD-1 (encoded by PDCD1) is included due to its relevance in clinical practice; again we do not achieve statistically significant results but do observe three marked outliers with PD-L1 expression >25%, all of which progressed to cancer. All p-values are calculated using linear mixed effects modeling to account for samples from the same patient; ***p < 0.001 **p < 0.01 *p<0.05 #p<0.1. Units for gene expression figures represent normalised microarray intensity values.

