. 2021 Jun 15;81(16):4290–4304. doi: 10.1158/0008-5472.CAN-20-3773

Figure 5.

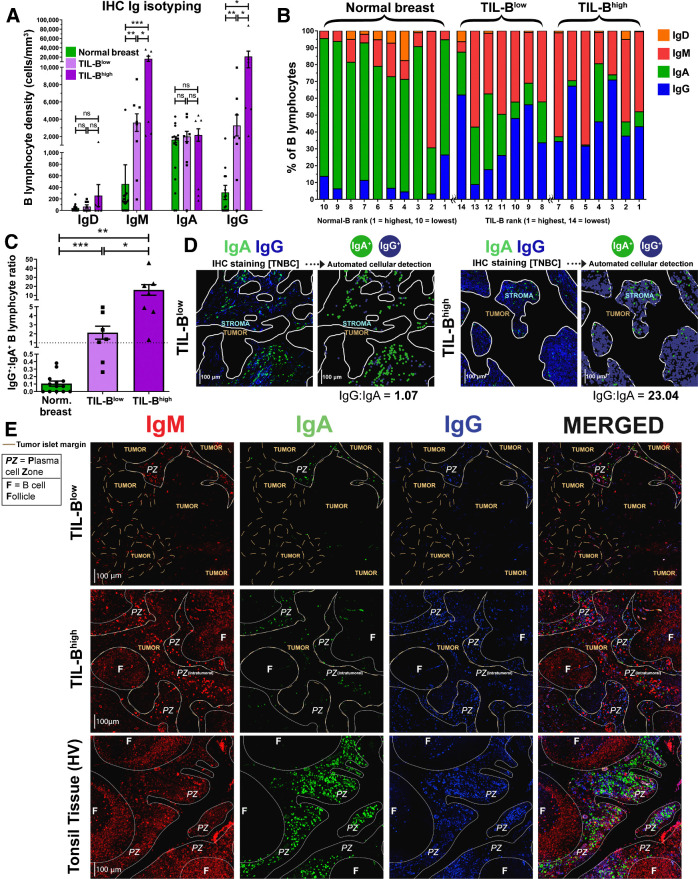
Figure 5. Quantitative fluorescence IHC reveals elevated IgG+:IgA+ ratio within high TIL-B tumors, implicating expansion of IgG+ B lymphocytes within TNBC tumor microenvironment. A, Comparison of surface immunoglobulin-expressing B lymphocyte density in normal breast and TNBC with low TIL-B density (below median CD20+) and high TIL-B density (above median CD20+). B, Quantitative IHC analysis profiling the proportions of B lymphocytes present within the microenvironment of normal breast tissue (N = 10) and TNBC (N = 14) expressing each Ig isotype. C, Enumeration of IgG+:IgA+ B lymphocyte ratios. D, Right, example images illustrating IgG+ and IgA+ B lymphocytes in a typical TIL-B low individual and a TIL-B high individual. Automated cellular detection identifies IgA (green) and IgG (blue) B lymphocytes. Scale bar, 100 μm. E, Representative images depicting typical Ig isotype expression among B lymphocytes: IgM+ (red), IgA+ (green), and IgG+ (blue). Images from Bart's IHC cohort. Brown dash lines indicate margin of the cancer. White lines separate distinct regions of B lymphocyte compartments (PZ, plasma cell zone; F, B lymphocyte follicle). Scale bar, 100 μm. Statistical significance was determined using the Student t-test. ns, nonsignificant; *, P < 0.05; **, P < 0.01; ***, P < 0.001.

Quantitative fluorescence IHC reveals elevated IgG+:IgA+ ratio within high TIL-B tumors, implicating expansion of IgG+ B lymphocytes within TNBC tumor microenvironment. A, Comparison of surface immunoglobulin-expressing B lymphocyte density in normal breast and TNBC with low TIL-B density (below median CD20+) and high TIL-B density (above median CD20+). B, Quantitative IHC analysis profiling the proportions of B lymphocytes present within the microenvironment of normal breast tissue (N = 10) and TNBC (N = 14) expressing each Ig isotype. C, Enumeration of IgG+:IgA+ B lymphocyte ratios. D, Right, example images illustrating IgG+ and IgA+ B lymphocytes in a typical TIL-B low individual and a TIL-B high individual. Automated cellular detection identifies IgA (green) and IgG (blue) B lymphocytes. Scale bar, 100 μm. E, Representative images depicting typical Ig isotype expression among B lymphocytes: IgM+ (red), IgA+ (green), and IgG+ (blue). Images from Bart's IHC cohort. Brown dash lines indicate margin of the cancer. White lines separate distinct regions of B lymphocyte compartments (PZ, plasma cell zone; F, B lymphocyte follicle). Scale bar, 100 μm. Statistical significance was determined using the Student t-test. ns, nonsignificant; *, P < 0.05; **, P < 0.01; ***, P < 0.001.