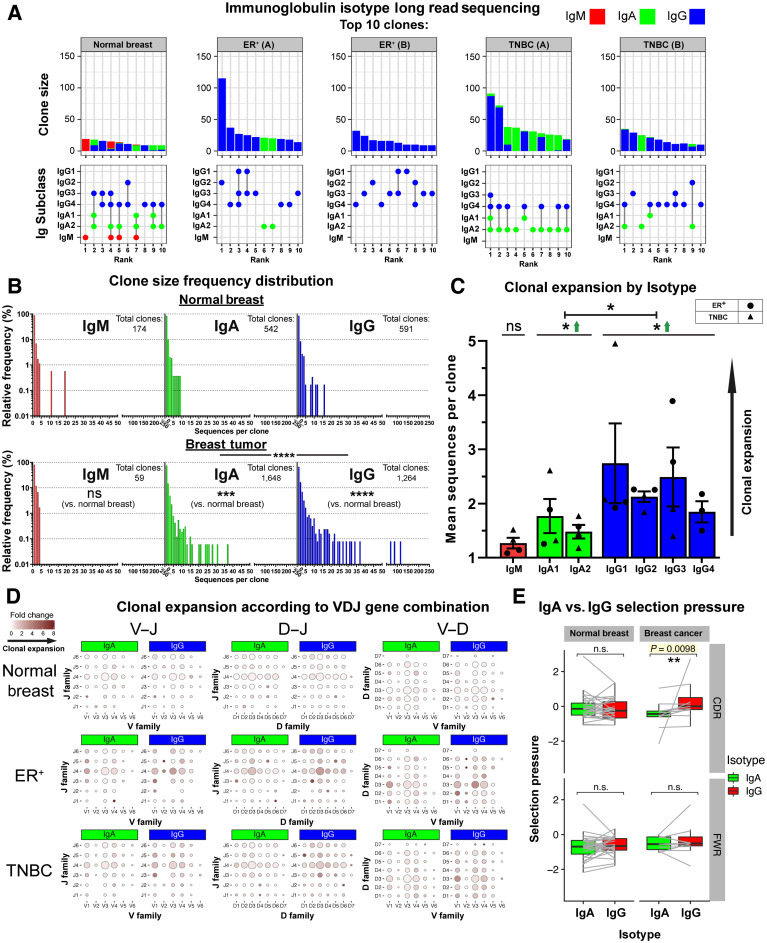
Figure 7.
B lymphocyte repertoire analyses of immunoglobulin isotype switching and clonal expansion in breast cancers. A, A total of 7,670 immunoglobulin heavy-chain sequences were analyzed (KCL sequencing cohort). Top 10 clones determined by B lymphocyte repertoire long read data analyses. Clonotypes were estimated via clustering CDR3 sequences. Top, bars depict sizes of clones and their breakdown by isotypes. Bottom, isotypes present in each clone are indicated by dots. Vertical lines signify co-occurrence of isotypes in the same clone. B, Clone size frequency distribution of IgM/IgA/IgG sequences in normal breast (1,771 sequences) and breast cancer (5,899 sequences). Kolmogorov–Smirnov analysis highlights significant differences in clone size frequency distributions. C, Mean sequences per clone of IgM/IgA/IgG isotypes. IgG and, to a lesser extent, IgA isotypes are clonally expanded, whereas on average, IgG isotypes have significantly larger clone sizes than IgA. D, Comparisons of IgA and IgG variable usage of V–J, D–J, and V–D genes extracted from normal breast, ER+ cancer, and TNBC. For each gene usage combination, dot size is proportional to the frequency before clonal expansion. Dot colors correspond to fold change in the number of sequences following clonal expansion, indicating the preference of B lymphocytes with that specific VDJ combination to be clonally expanded. E, Selection pressure in clonally related IgA and IgG. Clonally related sequences are represented as paired observations (gray lines), and selection pressure was considered separately for the complementarity determining regions and framework regions. Sequences are grouped into normal breast and breast cancer (containing two TNBC and two ER+ samples). Paired Wilcoxon tests were conducted, and P values were corrected (Benjamini–Hochberg) for multiple comparisons. ns, nonsignificant; *, P < 0.05; **, P < 0.01.

