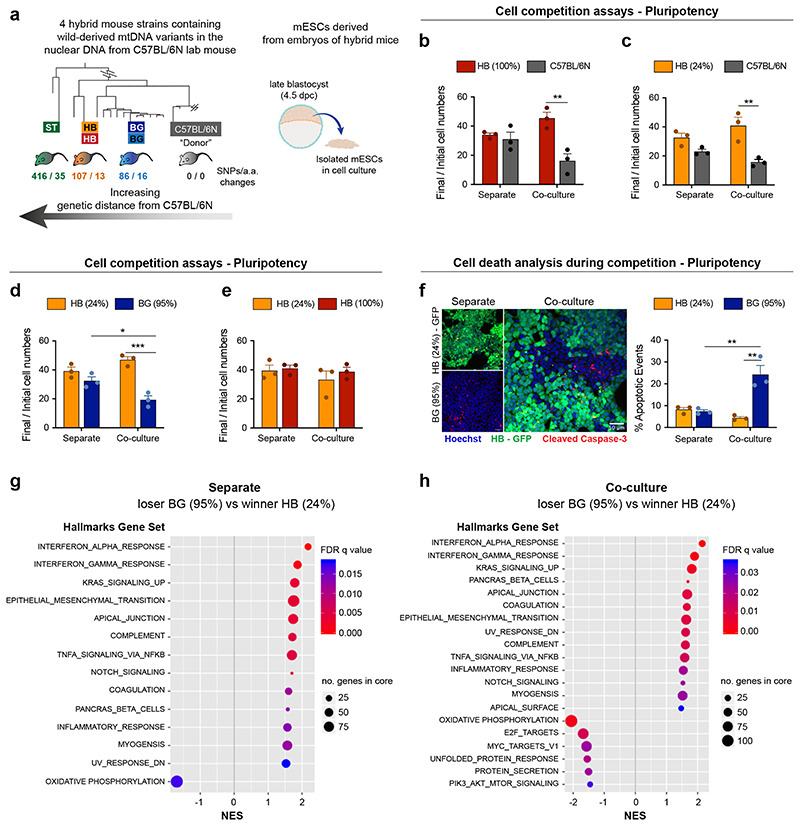
Fig. 7. Changes in mtDNA sequence can determine the competitive ability of a cell.
a, Derivation of mESCs from hybrid mouse strains, generated elsewhere by Burgstaller and colleagues. Neighbour-Joining Phylogenetic Analysis of mtDNA from wild and C57BL/6N mouse strains, that were used to generate hybrid mice (adapted from16), illustrates the genetic distance of the mtDNA from wild mouse strains to the C57BL/6N lab mouse. The number of single nucleotide polymorphisms and amino acid changes (SNPs/ a.a. changes) from wild to lab mouse strain is shown. mESCs were derived from embryos of hybrid mice, containing the nuclear background of a C57BL/6N lab mouse and mtDNA from three possible wild-derived strains (BG, HB or ST). b-e, Cell competition assays between cells derived from the embryos of hybrid mice performed in pluripotency maintenance conditions. The ratio of final/initial cell numbers in separate or co-culture is shown. f, Representative micrographs of cleaved caspase-3 staining and quantification of the percentage of apoptotic events in winners HB(24%) and loser BG(95%) mESCs maintained pluripotent and cultured in separate or co-culture conditions. g-h, Gene set enrichment analysis of differentially expressed genes from bulk RNA seq. in loser BG (95%) compared to winner HB (24%) mESCs maintained pluripotent and cultured in separate (g) or co-culture conditions (h). Gene sets that show positive normalized enrichment scores (NES) are enriched in loser cells, while gene sets that show negative NES are depleted in loser cells. Data obtained from 4 independent experiments (h). Remaining data shown as mean ± SEM of 3 independent experiments (b-f). See methods for details on statistical analysis.

