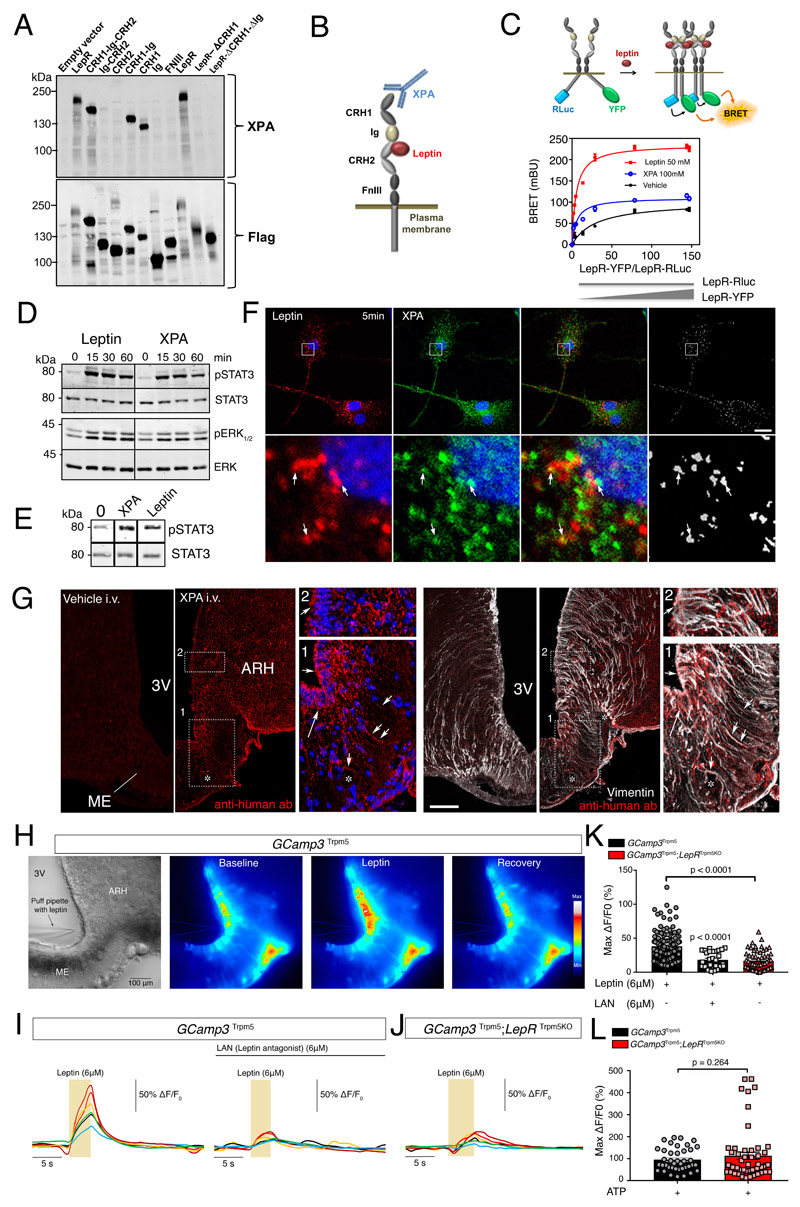
Figure 1. Tanycytes of the median eminence express functional leptin receptors.
(A) Representative Western blot detection using the XPA antibody of different exogenously expressed LepR domains in HEK293 cells. Experiments were repeated at least twice.
(B) Schematic representation of leptin receptor domains and the XPA binding site.
(C) Top: schematic representation of the BRET assay to study the ligand-induced conformational change/interaction between LepR-Rluc and LepR-YFP. Bottom: BRET donor saturation curves in HEK293T cells with a constant expression level of LepR-Rluc and increasing levels of LepR-YFP, upon stimulation with vehicle, leptin (50nM) or XPA (100nM) for 30 min at 37?°C.
(D) STAT3 and ERK1/2 phosphorylation in HEK293 cells stably expressing LepR after stimulation with 50 nM leptin or 100 nM XPA for 5, 15, 30 or 60 minutes. Representative Western blot out of at least 2 independent experiments.
(E) STAT3 phosphorylation in tanycytes upon 50 nM leptin or 100 nM XPA stimulation for 30 minutes. Representative Western blot out of 2 independent primary cultures of tanycytes.
(F) Leptin colocalizes with LepR in primary tanycytes. Representative confocal images of tanycytes treated for 5 min with 125 nM fluorescent leptin (red) together with 33 nM XPA antibodies against LepR labeled with fluorescent secondary antibodies (green). The extent of colocalization is represented by the mask on the right. Arrows point to examples of colocalized pixels. Scale bar: 10 μm. Experiments were repeated in 2 independent primary cultures of tanycytes.
(G) Representative photomicrograph revealing sites of XPA fixation in tanycytes of the median eminence (vimentin-positive cells) 2 minutes after intravenous XPA injection (2 nmol/animal) in vivo (n=3 mice per group). White arrows show XPA (red) and vimentin (white) colocalization. 3V: third ventricle; ARH: arcuate nucleus of the hypothalamus; ME: median eminence. Scale bar: 200μm.
(H) Representative image of a living brain slice containing the median eminence from a GCamp3 Trpm5 mouse under bright-field and fluorescence microscopy, showing the reversible increase in intracellular calcium levels in tanycytic cell bodies lining the third ventricle (3V) upon the local application of a puff of leptin (6μM) via a glass pipette. The experiment was repeated in 5 mice. ME: median eminence. Scale bar: 100 μm
(I) Representative curves of GCamp3 fluorescence (calcium current) over time (Delta T) compared to the baseline in tanycytes in living hypothalamic slices during a puff of leptin (yellow rectangle, 6uM), alone (left curve) or after pre-treatment with leptin antagonist (LAN, 6μM, top black line; right curve), in a GCamp3 Trpm5 mouse.
(J) Same measurement as in (I) in a GCamp3 Trpm5; LepR Trpm5 mouse lacking LepR in tanycytes after a puff of leptin (6μM, yellow rectangle).
(K) Graph representing maximum difference in calcium concentration from baseline during the treatment of living brain slices in GCamp3 Trpm5 and GCamp3 Trpm5; LepR Trpm5 mice, described in (I) and (J). Krustal Wallis with Dunn’s; N=5 (GCamp3 Trpm5 + leptin), 3 (GCamp3 Trpm5 + LAN and leptin) and 4 (GCamp3 Trpm5; LepR Trpm5) mice; each dot represents one cell (n=146,28,58). Values indicate means ± SEM.
(L) Graph representing maximum c difference in calcium concentration from baseline during a puff of ATP (10 mM) in living brain slices from GCamp3 Trpm5 and GCamp3 Trpm5; LepR Trpm5 mice. Mann-Whitney test; N=3 mice per condition; each dot represents one cell (n=40,53). Values indicate means ± SEM. See also Supplementary Figure 1.

