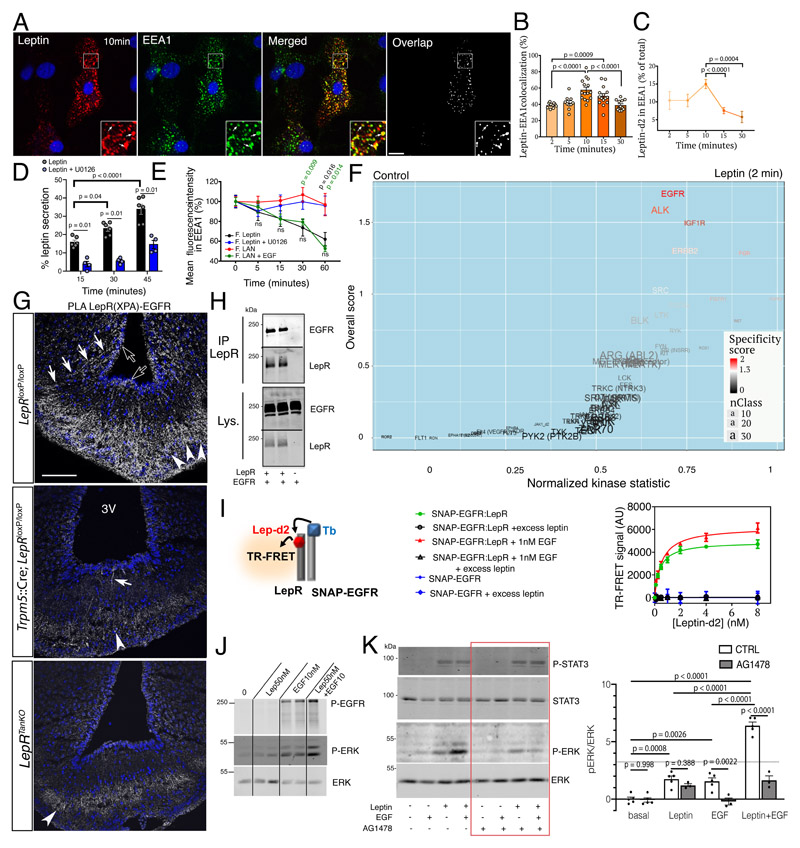
Figure 2. Tanycytic EGFR physically interacts with LepR in vivo and plays a role in leptin trancytosis in vitro .
(A) Endocytosed leptin colocalizing with early endosomes. Representative confocal images showing primary tanycytes treated for 10 min with 125 nM fluorescent leptin (red) and antibodies to the early endosome marker EEA1 (green). The extent of colocalization is represented by the mask on the right. Arrows in inset point to examples of colocalized pixels. Scale bar: 10μm.
(B) Percentage of leptin colocalizing with EEA1 over time following object-based detection of fluorescent leptin and EEA1 vesicles. Mann-Whitney test. n=10,10,15,15,12 cells as shown by individual dots from at least 2 independent primary cultures. Values represent means ± SEM.
(C) Percentage of endocytosed leptin found in the EEA1-positive compartment over time. Mann-Whitney test. n=11,11,15,13,9 cells at 2,5,10,15 and 30 min, respectively, from at least 2 independent primary cultures. Values represent means ± SEM.
(D) Leptin secreted into the medium by primary cultures of tanycytes as a percentage of total leptin concentration (intracellular and medium) 15, 30 and 45 minutes after fluorescent leptin addition. One-way ANOVA and Tukey’s test. n=4 and 6 wells cells as shown by individual dots from at least 2 independent primary cultures. Values represent means ± SEM.
(E) Percentage (as % of 0 min time point) of endocytosed fluorescent leptin or fluorescent LAN found in EEA1 compartments over time in cells treated or not with U0126 (leptin) or EGF (LAN). Mann-Whitney test. n=18,19,17,14,14 (leptin), 30,28,31,22,12 (LAN), 15,8,7,8,9 (Leptin+U0126) 15,13,14,13,10 (LAN+EGF) at 0,5,15,30,60 min, respectively, from at least 2 independent primary cultures. Values represent means ± SEM.
(F) Volcano plot showing differences in peptide phosphorylation between primary cultures of tanycytes treated for 2 min with vehicle (PBS pH 8.0) or leptin (1 μg/ml in PBS pH 8.0) (n=4 wells per condition). See also corresponding Source Data Files (Extended data Table 1 and 2).
(G) Proximity Ligation Assay (PLA) between LepR and EGFR using XPA and a rabbit anti-EGFR antibody. PLA signal is seen in tanycytic cell bodies (empty arrows), processes (white arrows) and end-feet in the external zone of the median eminence, where they contact the fenestrated endothelium of the pituitary portal circulation (arrowheads). Scale bar: 100 μm.
(H) Co‐immunoprecipitation of EGFR along with LepR in HEK293T cells; no co-immunoprecipitation of EGFR is observed when LepR is not expressed. IP, immunoprecipitation; Lys., cell lysate.
(I) Schematic representation of the TR-FRET technique (left). Right: specific saturation curves of leptin-d2 binding to its cognate receptor LepR within the LepR:SNAP-EGFR complex at the cell surface are obtained after 3h at 37°C. Data are presented as means ± SD of 3 replicates of 1 representative experiment out of 3 independent experiments.
(J) Phosphorylation of EGFR and ERK upon addition of leptin 50nM, EGF 10nM or both for 30min at 37°C in primary tanycytes.
(K) Phosphorylation of STAT3 and ERK upon addition of leptin 10nM, EGF 1nM or both for 30min at 37°C in HEK293T cells expressing endogenous EGFR and transfected with LepRb in the presence or absence of the EGFR inhibitor AG1478 (1μM). Two-way ANOVA and Sidak’s multiple comparison. n=5,5,3,5,3,5,3 wells as shown by individual dots from 2 independent experiments.

