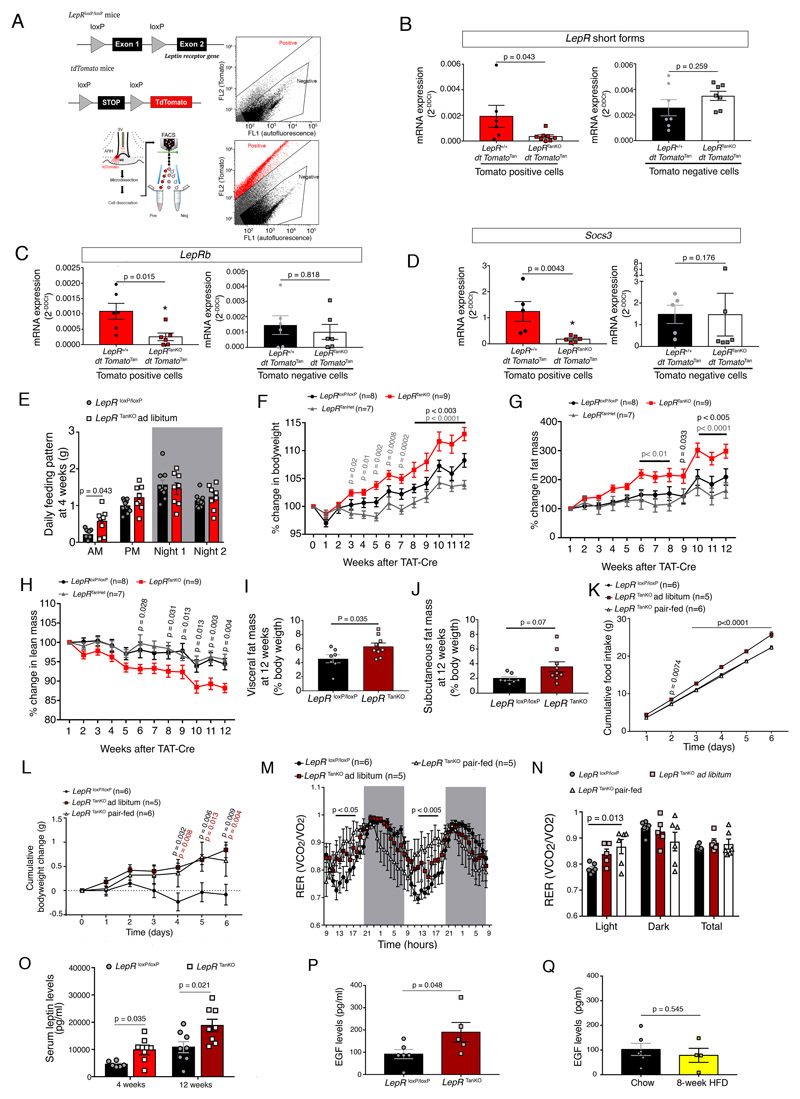
Figure 3. Selective LepR deletion in tanycytes causes food-intake-independent body weight gain and increased adiposity.
(A) Schematic diagram and gating strategy for sorting Tomato positive cells following vehicle (top panel) and TAT-Cre infusion (bottom panel) into the third ventricle (3V) of LepR +/+;tdTomatol oxP-STOP-loxP or LepR loxP/loxP;tdTomato loxP-STOP-loxP littermates.
(B-D) mRNA expression levels of short forms (B) and the long form, LepRb (C), of the leptin receptor, and of Socs3 (D) in tdTomato-positive cells (left panels) and tdTomato-negative cells (right panels). A two-sided unpaired Student t-test or Mann-Whitney U test was applied, depending on Shapiro-Wilk normality test results. Values indicate means ± SEM. Each dot represents a mouse (n=6,8,7,7 in B, 6,6,6,6 in C, 5,6,5,6 in D).
(E) Food intake pattern (daily average of automatic measurements in metabolic cages over 24h), showing an increase at lights-on in LepR TanKO mice when compared to LepRl oxP/loxP littermates. The night was divided in two 6h time slots (Night 1 and Night 2). Two-sided unpaired t-tests. Values indicate means ± SEM. Each dot represents a mouse (n=10,8).
(F-H) Curves representing the kinetics of the % change in body weight (F), % change in fat mass (G) and % change in lean mass (H) between LepR loxP/loxP, LepR TanHet and LepR TanKO through the 12 weeks following the TAT-Cre infusion into the 3V. Two-way ANOVA with Tukey’s correction; Values represent means ± SEM; n indicates the number of mice.
(I,J) Visceral fat mass (I) and subcutaneous (J) 12 weeks after TAT-Cre infusion. Mann-Whitney U test. Values indicate means ± SEM. Each dot represents a mouse (n=7,9).
(K) Cumulative food intake in LepR TanKO pair-fed mice 12 weeks after TAT-Cre infusion compared to their control littermates. Two-way ANOVA with Tukey’s correction. Values indicate means ± SEM; n indicates the number of mice.
(L) Cumulative body weight change. Two-way ANOVA with Tukey’s correction. Values indicate means ± SEM; n indicates the number of mice.
(M) Energy ratio (RER) over time. Two-way ANOVA with uncorrelated Fisher’s LSD test. Values indicate means ± SEM; n indicates the number of mice.
(N) Mean energy ratio (RER) during light phase, dark phase and total.Two-way ANOVA with Tukey’s correction. Values indicate means ± SEM. Each dot represents a mouse (n=6,5,5).
(O) Circulating leptin levels in LepRloxP/loxP and LepRTanKO animals at 4 weeks and 12 weeks after TAT-Cre infusion into the 3V. Mann-Whitney test (4 weeks) and two-sided unpaired t-test (12 weeks). Values represent means ± SEM. Each dot represents a mouse (n=6,7,8,8).
(P) Basal serum EGF concentrations in LepR loxP/loxP and LepR TanKO mice, 12 weeks after TAT-Cre infusion. Mann-Whitney U test. Values represent means ± SEM. Each dot represents a mouse (n=6,5).
(Q) Basal serum EGF concentrations in C57Bl/6J mice fed normal chow or those fed a high-fat diet for 8 weeks. Mann-Whitney U test. Values represent means ± SEM. Each dot represents a mouse (n=6,5).

