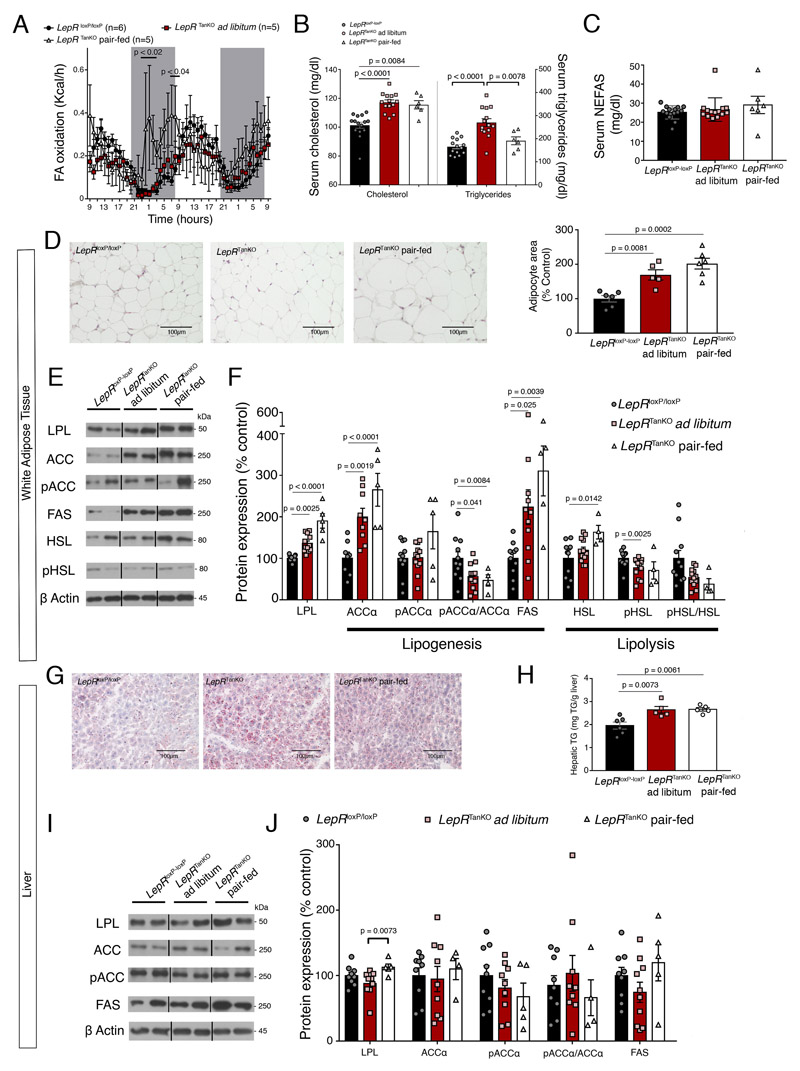
Figure 5. Selective LepR deletion in tanycytes causes hyperlipidemia and steatosis.
(A) Fatty-acid (FA) oxidation over time. 2-way ANOVA with uncorrelated Fisher’s LSD test. Values indicate means ± SEM; n indicates the number of mice.
(B) Graphs representing serum cholesterol and triglyceride concentrations in LepR loxP/loxP and LepR TanKO mice fed ad libitum on chow and LepR TanKO mice pair-fed with LepR loxP/loxP mice, 12 weeks after TAT-Cre infusion. One-way ANOVA with Tukey multiple comparison test or Kruskal-Wallis test with Dunn multiple comparison test were applied depending Shapiro-Wilk normality test results. Values indicate means ± SEM; each dot represents a mouse (n=15,14,6,14,14,6).
(C) Graph representing serum non-esterified fatty acid (NEFAS) concentrations in LepR loxP/loxP and LepR TanKO mice fed ad libitum on chow and LepR TanKO mice pair-fed with LepR loxP/loxP mice, 12 weeks after TAT-Cre infusion. One-way ANOVA with Tukey multiple comparison test. Values indicate means ± SEM; each dot represents a mouse (n=15,14,6).
(D) Representative images of histological hematoxylin-eosin staining of the adipose tissue in LepR loxP/loxP and LepR TanKO mice fed ad libitum on chow and LepR TanKO mice pair-fed with LepR loxP/loxP mice illustrating quantifications in the graph. Graph shows quantification of adipocyte size. One-way ANOVA with Tukey multiple comparison test. Values indicate means ± SEM; each dot represents a mouse (n=6,5,6).
(E) Representative western blots of the different proteins mentioned in (F).
(F) Graph representing protein expression levels of several proteins implicated in fatty acid synthesis or fatty acid lipolysis in white adipose tissue from LepR loxP/loxP and LepR TanKO mice, 12 weeks after TAT-Cre infusion. Lipoprotein lipase (LPL) is implicated in the lipids uptake from the circulation to the adipose tissue. One-way ANOVA with Tukey multiple comparison test or Kruskal-Wallis test with Dunn multiple comparison test. Values indicate means ± SEM; each dot represents a mouse (n=11,12,5).
(G) Representative Oil-Red-stained images from the liver of LepR loxP/loxP and LepR TanKO mice fed ad libitum and LepR TanKO mice pair-fed with LepR loxP/loxP mice illustrating quantifications in H.
(H) Quantification of triglycerides in the liver of LepR loxP/loxP and LepR TanKO mice fed ad libitum and LepR TanKO mice paired-fed with LepR loxP/loxP mice. One-way ANOVA with Tukey multiple comparison test. Values indicate means ± SEM; each dot represents a mouse (n=6,5,5).
(I) Representative western blots of the different proteins mentioned in (J).
(J) Graph representing protein expression levels of several proteins implicated in fatty acid synthesis and lipid uptake from the circulation into the liver in LepR loxP/loxP and LepR TanKO mice fed ad libitum and LepR TanKO mice paired-fed with LepR loxP/loxP mice, 12 weeks after TAT-Cre infusion. One-way ANOVA with Tukey multiple comparison test. Values indicate means ± SEM; each dot represents a mouse (n=9,10,4).

