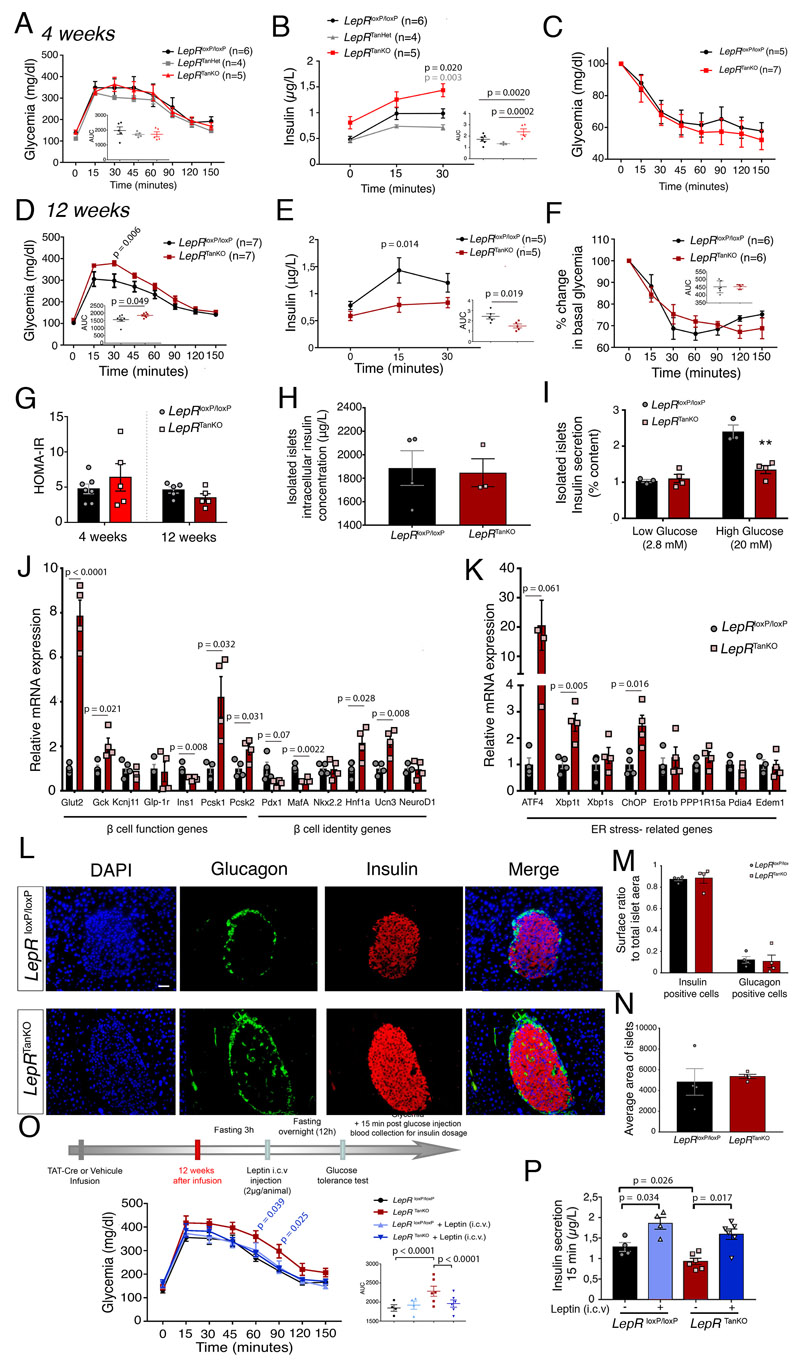
Figure 6. Loss of LepR expression in median eminence tanycytes causes severe pancreatic β cell dysfunction possibly due to defective noradrenaline activity.
(A) Curve representing glycemia during a glucose tolerance test in LepR loxP/loxP, LepR TanHet and LepR TanKO mice, 4 weeks after TAT-Cre infusion. Graph represents the area under the curve; two-way ANOVA with Tukey’s correction. Values indicate means ± SEM; n indicates the number of mice.
(B) Serum insulin concentrations during the first 30 mins of a glucose tolerance test in LepR loxP/loxP, LepR TanHet and LepR TanKO mice, 4 weeks after TAT-Cre infusion; two-way ANOVA with Tukey’s correction. Values indicate means ± SEM; n indicates the number of mice.
(C) Graph representing serum insulin concentrations at T0 of the glucose tolerance test; two-sided t-test. Values indicate means ± SEM; n indicates the number of mice.
(D) Curve representing glycemia during a glucose tolerance test in LepR loxP/loxP and LepR TanKO mice, 12 weeks after TAT-Cre infusion; two-way ANOVA with Tukey’s correction. Values indicate means ± SEM; n indicates the number of mice.
(E) Serum insulin concentrations during the first 30 mins of a glucose tolerance test in LepR loxP/loxP and LepR TanKO mice, 12 weeks after TAT-Cre infusion; two-way ANOVA with Tukey’s correction. Values indicate means ± SEM; n indicates the number of mice.
(F) Percentage change in basal glycemia during an insulin tolerance test in LepR loxP/loxP and LepR TanKO mice, 12 weeks after TAT-Cre infusion. Two-way ANOVA with Sidak’s multiple comparaison (two-sided unpaired t-test for AUC, inset). Values indicate means ± SEM; n indicates the number of mice.
(G) HOMA-IR. Two-sided unpaired t-test. Values indicate means ± SEM; each dot represents a mouse (n=7,5,5,5).
(H) Graph representing insulin secretion from total isolated pancreatic islets from LepR loxP/loxP and LepR TanKO mice, 12 weeks after TAT-Cre infusion, following treatment with low or high glucose concentrations. Two-sided unpaired t-test. Values indicate means ± SEM; each dot represents a mouse (n=3,4).
(I) Graph representing insulin concentrations in isolated pancreatic islets from LepR loxP/loxP and LepR TanKO mice, 12 weeks after TAT-Cre infusion. Two-way ANOVA with Tukey’s multiple comparaison. Values indicate means ± SEM; each dot represents a mouse (n=3,4).
(J) Relative mRNA expression levels of markers of β-cell function and identity in isolated pancreatic islets from LepR loxP/loxP and LepR TanKO mice, 12 weeks after TAT-Cre infusion. A two-sided unpaired Student t-test or Mann-Whitney U test was applied, depending on Shapiro-Wilk normality test results. Values indicate means ± SEM; each dot represents a mouse (n=4,4).
(K) Relative mRNA expression levels of ER stress markers in isolated pancreatic islets from LepR loxP/loxP and LepR TanKO mice, 12 weeks after TAT-Cre infusion. A two-sided unpaired Student t-test or Mann-Whitney U test was applied, depending on Shapiro-Wilk normality test results. Values indicate means ± SEM; each dot represents a mouse (n=4,4).
(L) Representative confocal images representing nuclei (blue), glucagon (green) and insulin (red) in isolated pancreatic islets from LepR loxP/loxP and LepR TanKO mice, 12 weeks after TAT-Cre infusion illustrating quantifications in M. Scale bar: 50 μm.
(M) Graphs representing the ratio between insulin-positive (left) or glucagon-positive area (right) to the total islet surface area in LepR loxP/loxP and LepR TanKO mice, 12 weeks after TAT-Cre infusion. Two-way ANOVA with Tukey’s multiple comparison. Values indicate means ± SEM; each dot represents a mouse (n=4,4).
(N) Graph representing the average surface area of pancreatic islets from LepR loxP/loxP and LepR TanKO mice, 12 weeks after TAT-Cre infusion. Mann-Whitney test. Values indicate means ± SEM; each dot represents a mouse (n=4,4).
(O) Curve representing glycemia during a glucose tolerance test in LepR loxP/loxP and LepR TanKO mice, before (black and red curves) and after (light and dark blue curves) i.c.v. leptin injection (2μg/animal). Graph represents the area under the curve; one-way ANOVA with Tukey’s correction. Values indicate means ± SEM. The n number of mice is identical in the main graph and bottom right graph, where each mouse is represented by a dot (n=4,4,6,6).
(P) Serum insulin concentrations at 15 minutes during the glucose tolerance test presented in (O). A paired two-sided t-test was applied for comparisons between the same group before and after leptin injection and a two-sided unpaired t-test. Values indicate means ± SEM; each dot represents a mouse (n=4,4,6,6).

