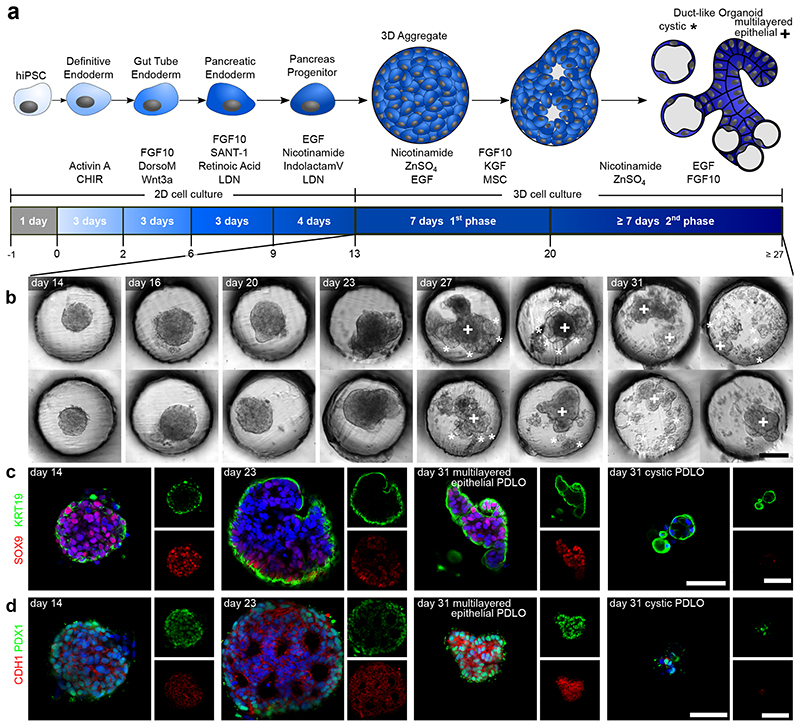
Fig. 2. PDLO differentiation in the microwell chip.
a, Schematic of cell differentiation from hiPSCs to PDLOs. b, Representative bright-field images of 3D pancreatic progenitors aggregates after 14, 16, 20, 23, 27, and 31 days of differentiation (DOD). Morphological changes of organoids within the first differentiation phase between 14 to 20 DOD, and formation of two morphologically distinct PDLO types within the second differentiation phase. Multi-layered epithelial PDLOs are marked with a cross (+) and cystic types with a star (*), respectively. See Supplementary Fig. 3a for overview images. c and d, Fluorescence images of the 3D aggregates along the time course of differentiation with co-stained ductal protein markers SOX9, KRT19, PDX1, and CDH1, respectively. A comprehensive set of progenitor and ductal markers is depicted in Supplementary Fig. 3b-e. The nucleus was counterstained with DAPI. Scale bar denotes 50 μm.

