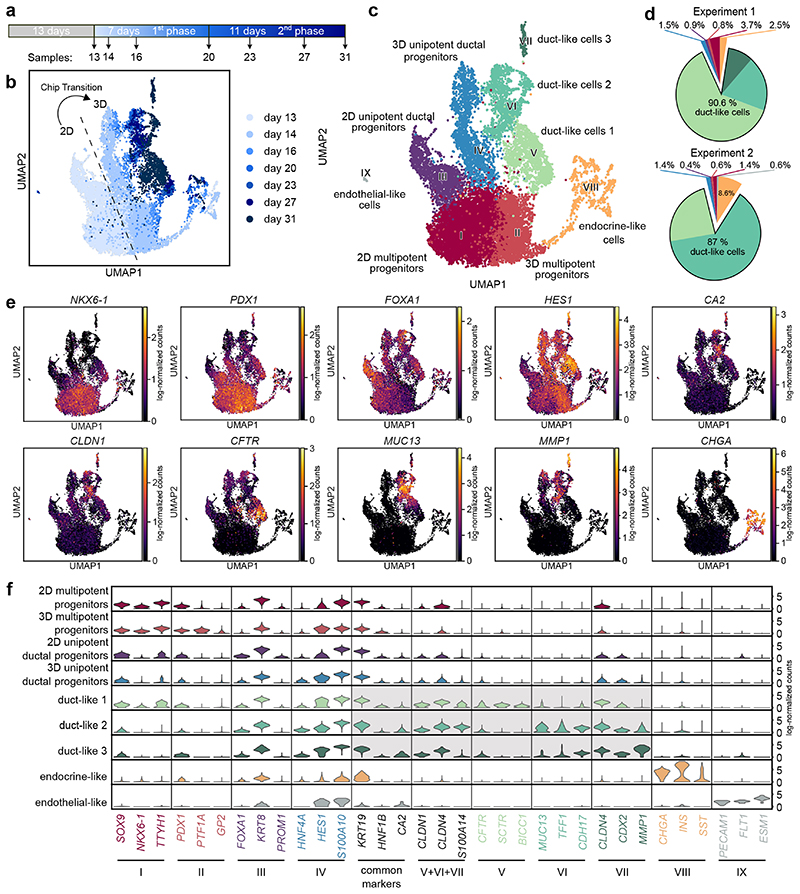
Fig. 4. scRNA-seq identifies cellular heterogeneity along the differentiation from pancreatic progenitors to PDLOs.
a, Schematic representing the sampling time during the ductal differentiation. b, UMAP plot of the single-cell transcriptomes recorded along the time course of ductal differentiation. The light to dark blue colour denotes the time points of sampling. c, UMAP cell cluster representation of the scRNA-seq data. Nine unique cell clusters were identified during the ductal differentiation. d, Cell type distribution at the end-point of two independent ductal differentiation experiments. e, Expression patterns of selected cell marker genes used for pancreatic cluster assignments. Further marker genes are depicted in Supplementary Fig. 7a. f, Violin plot shows mRNA expression levels of differentially expressed genes specific to one of the nine cell clusters and commonly used pancreatic ductal markers as indicated below the graph.

