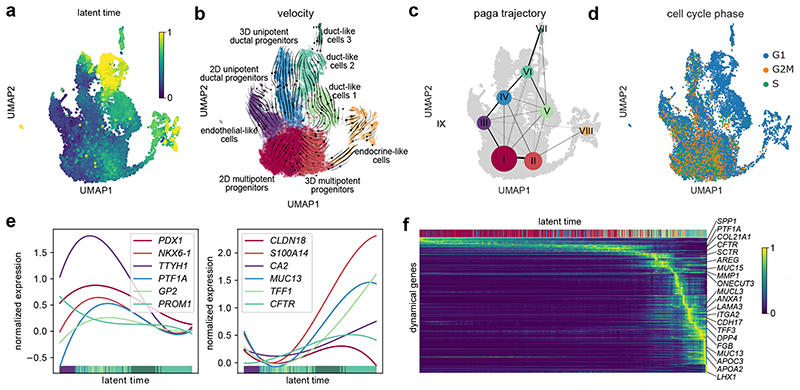
Fig. 6. Recovery of transcriptome dynamics predicts differentiation paths for duct-like cell types.
a, UMAP cluster plot coloured with the latent time calculated based on dynamic RNA analysis. b, Velocity and c, PAGA maps reveal the cellular state progressions during ductal differentiation. Streamlines in b indicate the direction of cellular state changes in the velocity map, and weighted lines in c within the graph network indicate higher cell cluster relations. d, UMAP plot highlighting the cell cycle state of differentiating cells. e, Gene expression profiles of progenitor or duct characteristic marker genes along the latent time, respectively. f, Top 300 dynamical genes sorted accordingly to their likelihood score and cells arranged along latent time.

