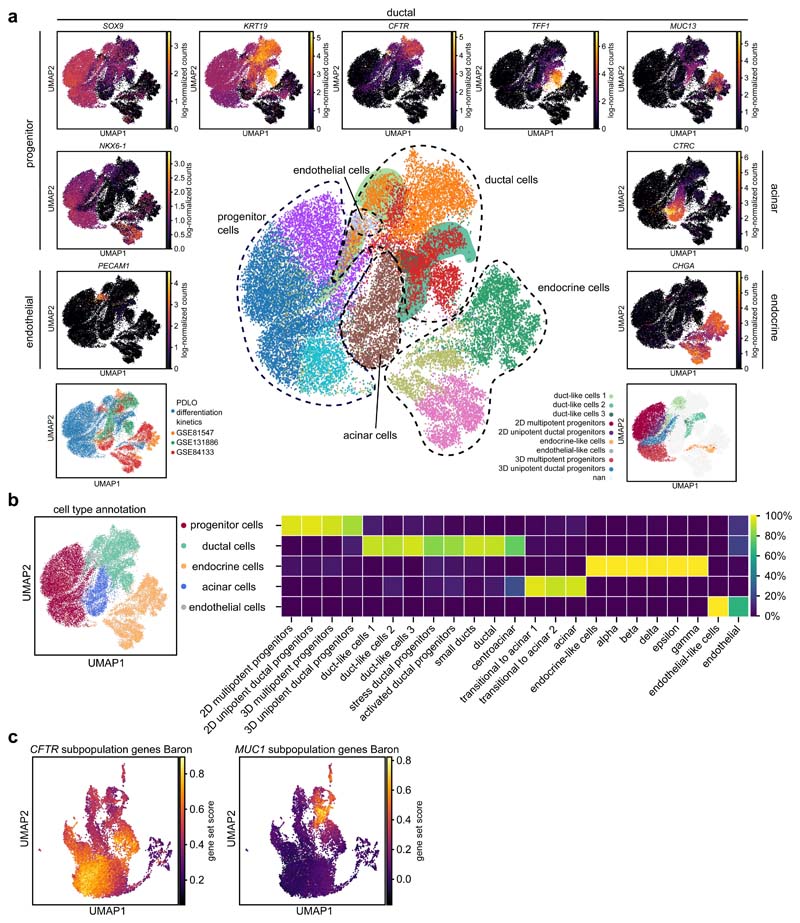
Fig. 7. Duct-like cells of the PDLOs clustered with primary ductal cells and resembled CFTR+-/mucin+-subpopulations.
a, Integration of three primary pancreas scRNA-seq data sets23,24,26 (bottom left) into 10 Louvain clusters (middle plot, duct-like PDLO cells are highlighted by areas in their cluster colour). UMAP expression plots display cell type-specific marker gene expression (surrounding graphs). Bottom right illustrates the location of our PDLO differentiation kinetics. Analysis of the CFTR+-/mucin+- subpopulations in the isolated scRNA-seq data set of Qadir, et al.26 can be found in Supplementary Fig. 10. b, Annotated cell types with their percentile distribution of the original clusters. c, Enriched expression of the marker genes for the CFTR high/MUC1 low and MUC1 high/CFTR low subpopulations defined in Baron, et al.24 during PDLO differentiation.

