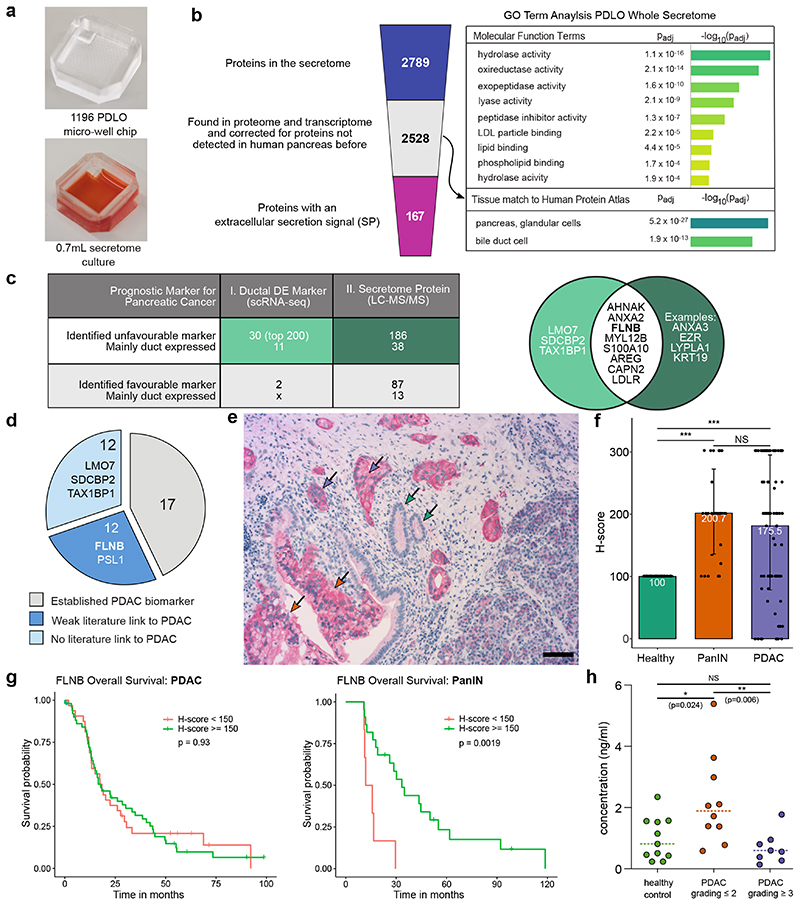
Fig. 8. Potential PDAC biomarkers within the secretome and transcriptome of PDLOs.
a, Microwell chip used for the determination of the PDLO secretome by LC-MS/MS of three biological replicates, including one, two and five technical replicates. b, Left: Filter process applied to the secretome data. Right: GO terms enriched within the filtered PDLO secretome with relevance for ductal function. c, Prognostic pancreatic cancer markers within the top 200 DEGs of the combined duct-like clusters from the scRNA-seq analysis and within the PDLO secretome. The Venn diagram highlights the overlap between the revealed unfavourable diagnostic markers for pancreatic cancer from the scRNA-seq and secretome analysis. Pancreatic duct expression was assessed by examination of Human Protein Atlas staining63. d, Literature survey for the set of unfavourable diagnostic markers from table c. e, IHC staining of FLNB within PDAC tissue. Purple arrows indicate PDAC, orange arrows PanINs, and green arrows healthy ducts. Scale bar denotes 50 μm. Complementary images are shown in Supplementary Fig. 12. f, Mean FLNB H-score in heathy, (n=86), PanIN (n=28) and PDAC (n=84) tissue. Error bars denote standard deviation. The Mann-Whitney U test was applied to calculate statistical significance. Significance levels are indicated as follows: *: p-value<0.05; **: p-value< 0.01; ***: p-value<0.001. g, Overall survival curve for patients with high and low FLNB H-score. High FLNB H-scores in PanINs correlated with a favourable prognosis for patients. P-value was calculated with the log-rank test. h, Median FLNB blood concentration in a healthy control group (n=11) and patients with PDAC grade ≤2 (n=10) and ≥3 (n=7). The Mann-Whitney U test was used to calculate statistical significance. Significance levels are the same as in f.

