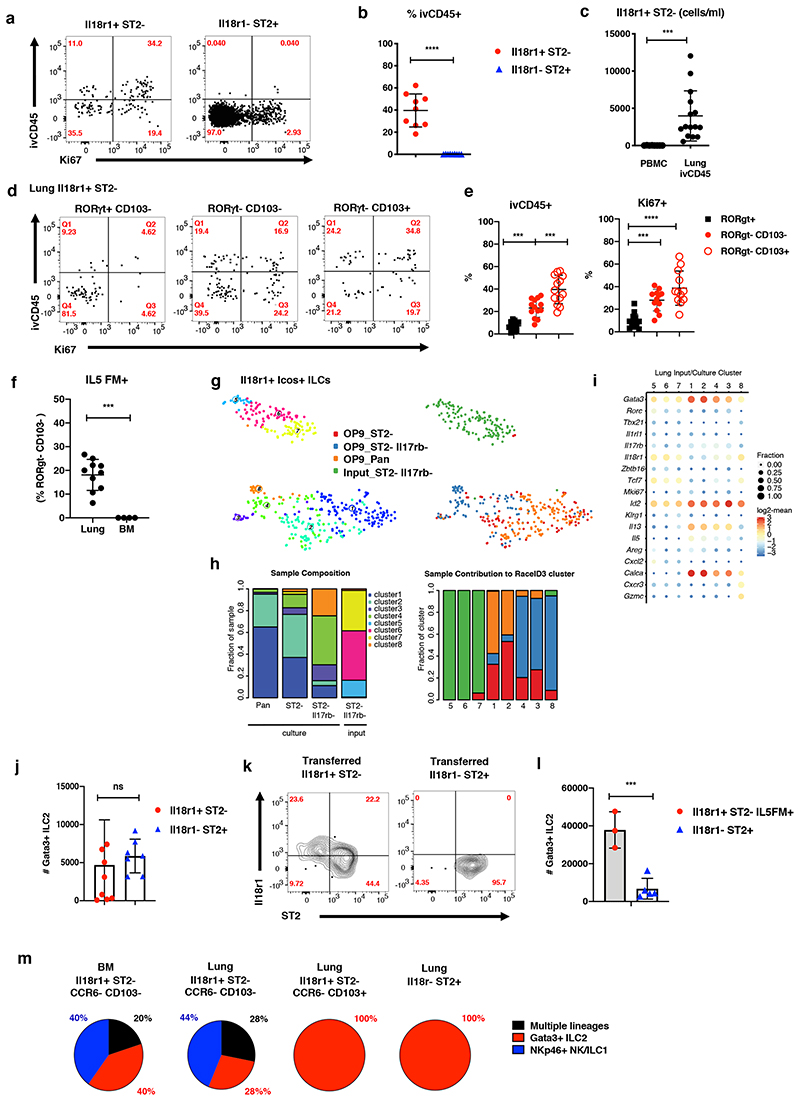
Figure 3. Il18r1+ ILCs are immature cells that give rise to Gata3hi ILC2s in the lung.
(A-B) FACS analysis of Ki67 expression and intravenous CD45 label (ivCD45) in Il18r1+ST2-RORγt+Klrg1- and Il18r1-ST2+ adult lung ILC2s. Representative gating (A) and percentage of ivCD45+ cells within indicated ILC subsets (B). (C) Number of Lin-Il7ra+Il18r1+ cells per ml blood in PBMCs (Il18r1+ST2- ILCs) and lung (ivCD45+Il18r1+ST2-RORγt+Klrg1- ILCs). Graphs in (B) and (C) depict data as mean ± SD (unpaired t-test, *P < 0.05, **P < 0.01; ***P < 0.001; ****P < 0.0001; ns, not significant). (D-E) Representative gating (D) and percentage of Ki67+ and ivCD45+ cells (E) for indicated Il18r1+ST2- ILC subsets in adult lung. Data are pooled from 3-4 independent experiments (n=4-16 mice). (F) Percentage of Il5Cre fate-mapped (Il5FM+) Il18r1+ST2-RORγt-CD103- ILCs in lung and BM. RORγt staining was used to exclude ILC3. Data are pooled from 2-3 independent experiments (n=4-9 mice). Graphs in (E) and (F) depict data as mean ± SD (one-way ANOVA Tukey’s multiple comparisons test (E) or unpaired t-test (b, c, f), ***P < 0.001; ****P < 0.0001). Data are pooled from 3-4 independent experiments with a total of n = 8-15 mice). (G) t-SNE representation of single-cell transcriptomes of lung Il18r1+Icos+ ILCs before (“input”) and after culture (“output”) highlighting RaceID3 clusters. (H) Cluster composition of samples (left) and sample composition of clusters (right, for legend see (G)). (I) Expression of candidate genes for input and output populations. Color represents log2 mean expression in the respective cluster and dot size indicates fraction of cells expressing the gene in the cluster. (J) Total number of Gata3+ ILC2s after culture of indicated lung ILCs for 15 days in the presence of Il2, Il7, SCF, Il25 and Il33 on OP9-DL1 for 15 days. (K) FACS analysis of Lin-Il7ra+ lung ILCs on d21 post transfer into sublethally irradiated CD45.2+RAG-/-γc-/- mice. Congenically marked Il18r1+ST2- and Il18r1-ST2+ ILCs sorted from lungs of d2 Nb infected mice were cotransferred (2,000 cells each). Data are representative of 2 individual experiments (n=3 mice). (L) Total number of Gata3+ ILC2 after culture of indicated lung ILCs as in (J). Data in (J) and (L), are pooled from 2 independent experiments with n=3-4 repeat wells each. (M) Indicated lung and BM ILC subsets were sorted as single cells onto OP9-DL1 monolayers and cultured for 19 days. Clonal progeny was analyzed by FACS. Pie charts indicate distribution of culture output across positive single cell cultures.

