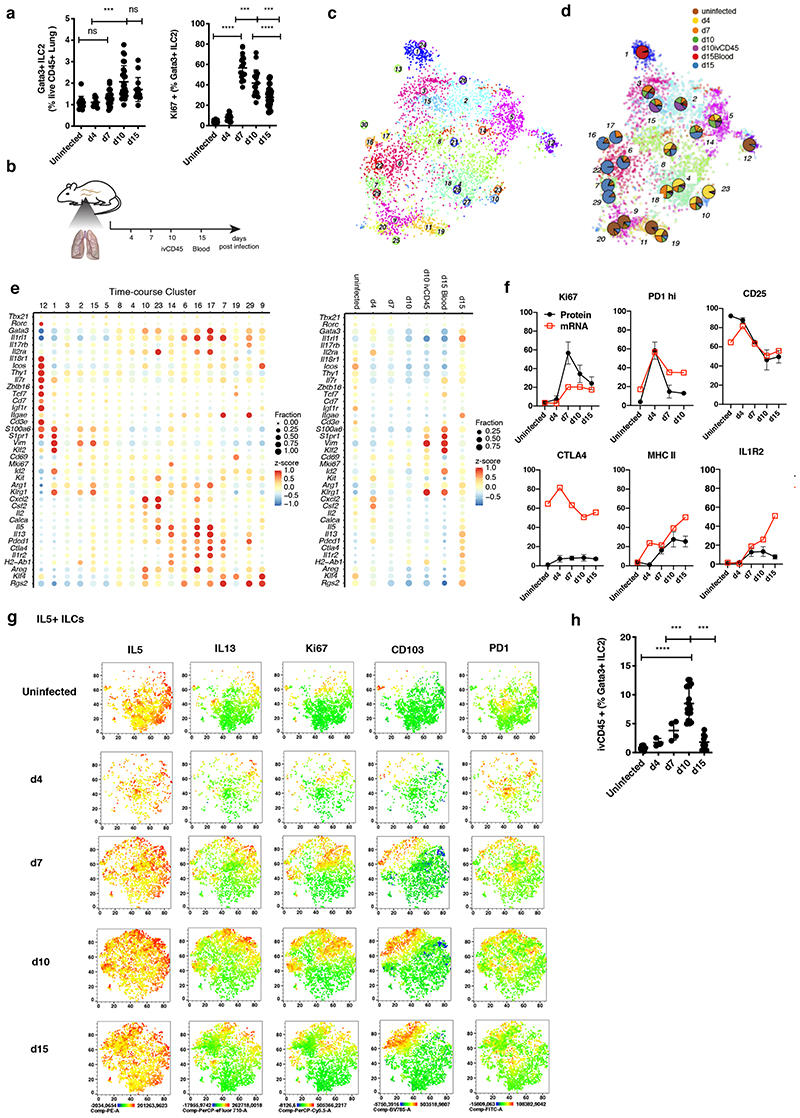
Figure 4. Emerging heterogeneity of lung ILC2s during Nippostrongylus brasiliensis infection.
(A) FACS analysis of the fraction of Lin-Gata3+ ILC2s among live CD45+ cells (left) and of Ki67+ cells among Lin-Gata3+ ILC2s (right) in Nb infected lungs. Data are pooled from 3 independent experiments with a total of n=12-16 mice per time point. (B) Sequenced samples at the respective time-points during Nb infection. (C) t-SNE map of combined Nb infection time-course and uninfected lung data (cf. Figure 1) highlighting RaceID3 clusters. (D) Overlay of t-SNE map from (C) with pie charts indicating normalized sample contribution to clusters. (E) Expression of candidate genes for ILC subsets for inferred time-course clusters with at least 20 cells (left) or the respective sample (right). Color represents z-score of mean expression across clusters/samples and dot size represents fraction of cells positive for the gene in the cluster/sample. (F) Time-course FACS analysis of the fraction of ivCD45+ ILC2s in Nb infected lungs. FACS data are pooled from 2-3 independent experiments with n=6-12 mice per time point. (G) Time-course FACS analysis of Il7ra+ ILCs in Nb infected lungs (black) compared with fractions of RNA expressing cells of time-course dataset (red). FACS data are pooled from 2-3 independent experiments with n=6-9 mice per time point. (H) Time-course FACS analysis of Nb infected lungs. Expression of indicated markers represented as t-SNE maps for Il5+ ILCs. ICS after incubation with PMA, ionomycin and monensin.Data are pooled from 5 mice for each time point and merged from equal numbers of Lin-Il7ra+ ILCs. Graphs in (A) and (F) depict data as mean ± SD (one-way ANOVA Tukey’s multiple compari sons test, ***P < 0.001; ****P < 0.0001).

