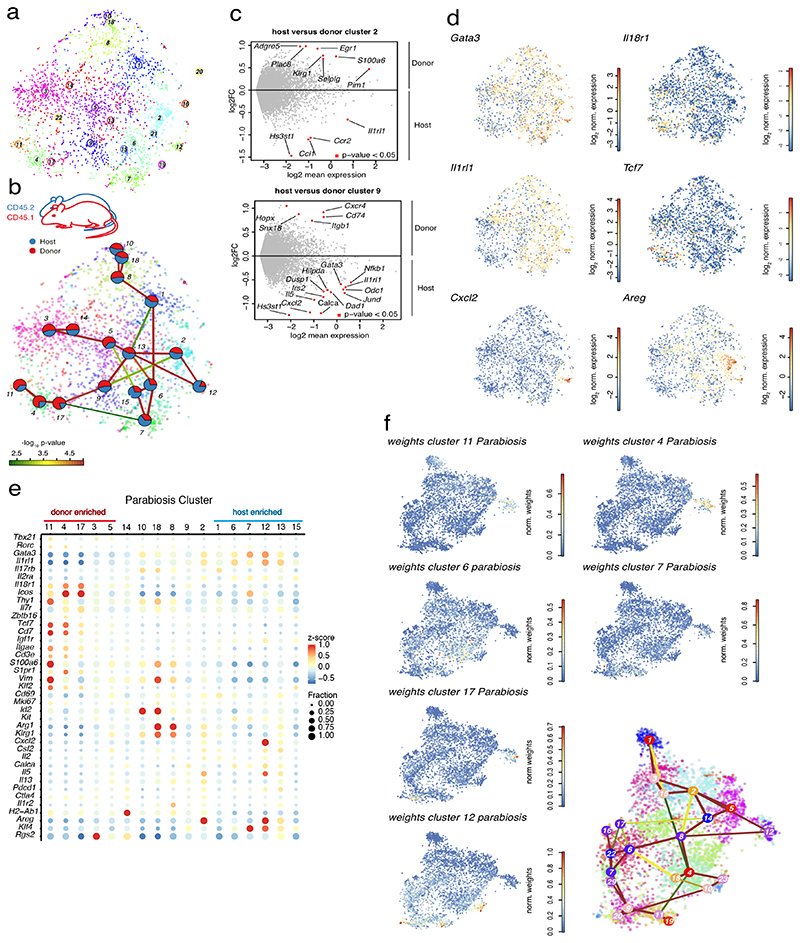
Figure 6. Recruited cells contribute to the entire phenotypic spectrum of lung ILC2s during Nippostrongylus brasiliensis infection.
(A) t-SNE map of cells derived from parabiotic mice at d15 p.i. highlighting RaceID3 clusters. (B) StemID2 lineage inference and normalized donor and host contribution to clusters depicted as pie-charts. Link color indicates p-value of StemID2 links (P < 0.05, Methods). (C) Differentially expressed genes (P < 0.05, Methods) between donor and host cells within the depicted clusters. (D) t-SNE maps indicating log2 normalized expression of candidate genes in the parabiosis data. (E) Expression of representative candidate genes for ILC subsets in parabiosis clusters with at least 20 cells. Color represents z-score of mean expression across clusters and dot size represents fraction of cells expressing the gene in the cluster. (F) t-SNE map of parabiosis data showing normalized weights of indicated parabiosis cluster medoids for cells within the Nb timecourse data (cf. Figure 4) as computed by cluster mapping (Methods).

