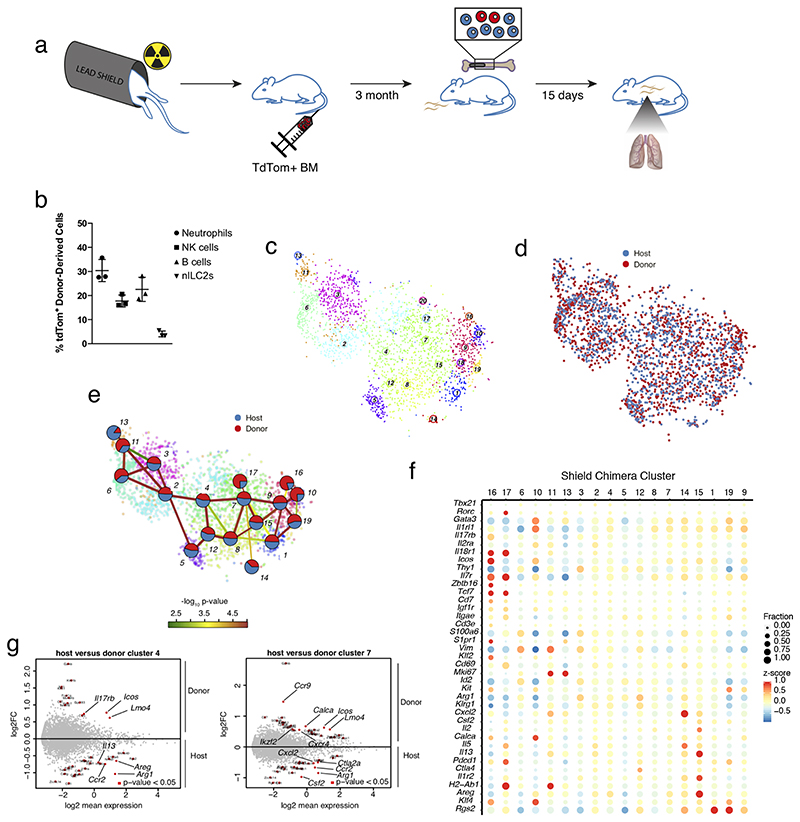
Figure 7. Bone marrow-derived ILCs give rise to the full phenotypic spectrum of ILC2s in the adult lung.
(A) Nb infection of the shield chimera model. (B) Frequency of donor-derived cells from transferred bone marrow (BM). (C-D) t-SNE map of ILCs from shield chimeric mice isolated at d15 p.i. highlighting RaceID3 clusters (C) and donor or host origin for each cell (D). (E) StemID2 lineage inference and normalized donor and host contribution to clusters depicted as pie-charts. Link color indicates p-value of StemID2 links (P < 0.05, Methods). (F) Expression of candidate genes for ILC subsets in the shield chimera clusters with at least 10 cells. Color represents z-score of mean expression in a cluster and dot size represents fraction of cells expressing the gene in the cluster. (G) Differentially expressed genes (P < 0.05, Methods) between donor and host cells within the depicted clusters.

