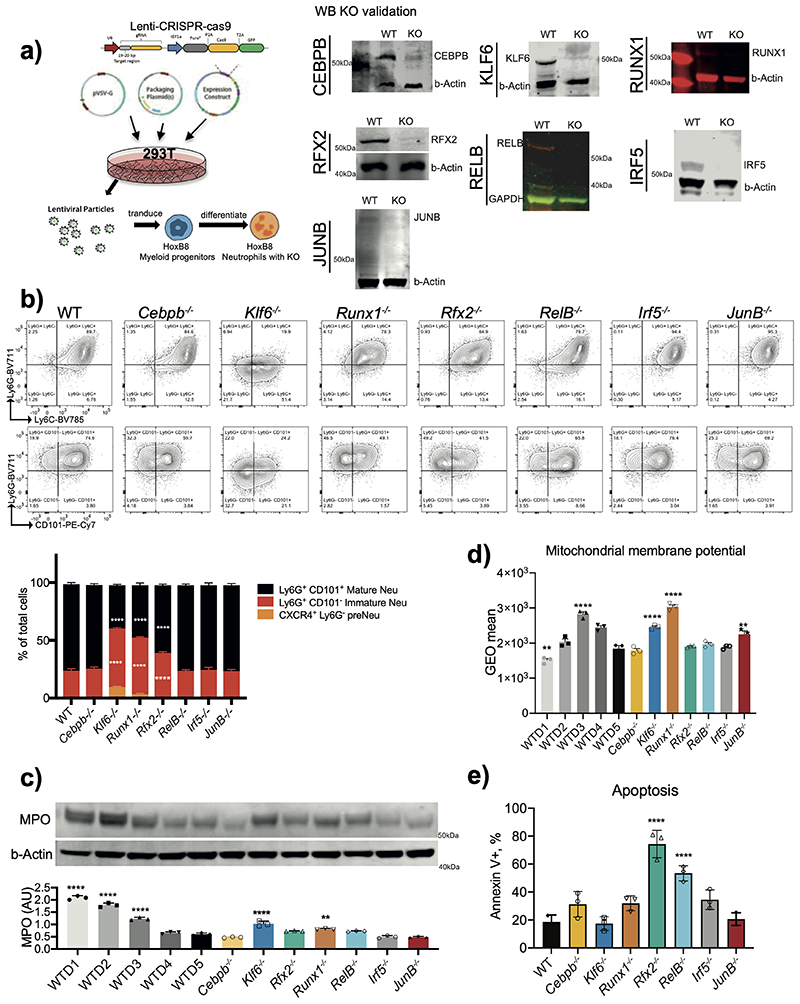
Extended Data Fig. 5. Validation and maturation of TF knockout neutrophils.
a) Targeted TF knockout of HoxB8 neutrophils. Left: Schematic of in vitro generation, CRISPR-Cas9 lentivirus transduction and subsequent differentiation into neutrophils in the presence of G-CSF. Right: Immunoblots for validating TF knockout from HoxB8 neutrophils, and representative blots from three independent experiments are shown.
b) Representative flow cytometry plots(top) of WT or CEBPβ–/–, Klf6–/–, Runx1–/–, Rfx2–/–, RelB–/–, Irf5–/– or JunB–/– HoxB8 neutrophils co-labelled with Ly6C, Ly6G and CD101. Quantification of flow cy-tometry data as percentages of pre-neutrophils Ly6G-CXCR4+, immature Ly6G+CD101- and mature Ly6G+CD101+ neutro-phils (bottom). Data are shown as means and SD and are representa-tive of three independent experi-ments. Significant differences com-pared with the WT control group are denoted as: ****P<0.0001 (two-way ANOVA with Dunnett’s multiple comparisons test).
c) Myeloperoxidase (MPO) expression in HoxB8 neutrophils. A representative Western blot probed with antibodies specific for MPO and b–Actin is shown. MPO expression is normalized against b-Actin amount in the lysates (and expressed as arbitrary unit of MPO).
d) Mitochondrial transmembrane potential of WT and indicated KO HoxB8 neutrophils measured by flow cytometry using TMRM.
e) Early apoptosis rates of HoxB8 neutrophils differentiated for five days as assessed by the percentage of cells positive for the Annexin V staining and negative for the live/dead staining. Data are shown as means and SD from three independent experiments, each with duplicate.
c, d, e) Data are shown as means and SD and are representative of three independent experiments. Significant differences compared with WT neutrophils are denoted as: **P<0.01, ***P<0.001, ****P<0.0001; (Oridinary one-way ANOVA with Dunnett’s multiple comparisons test).

