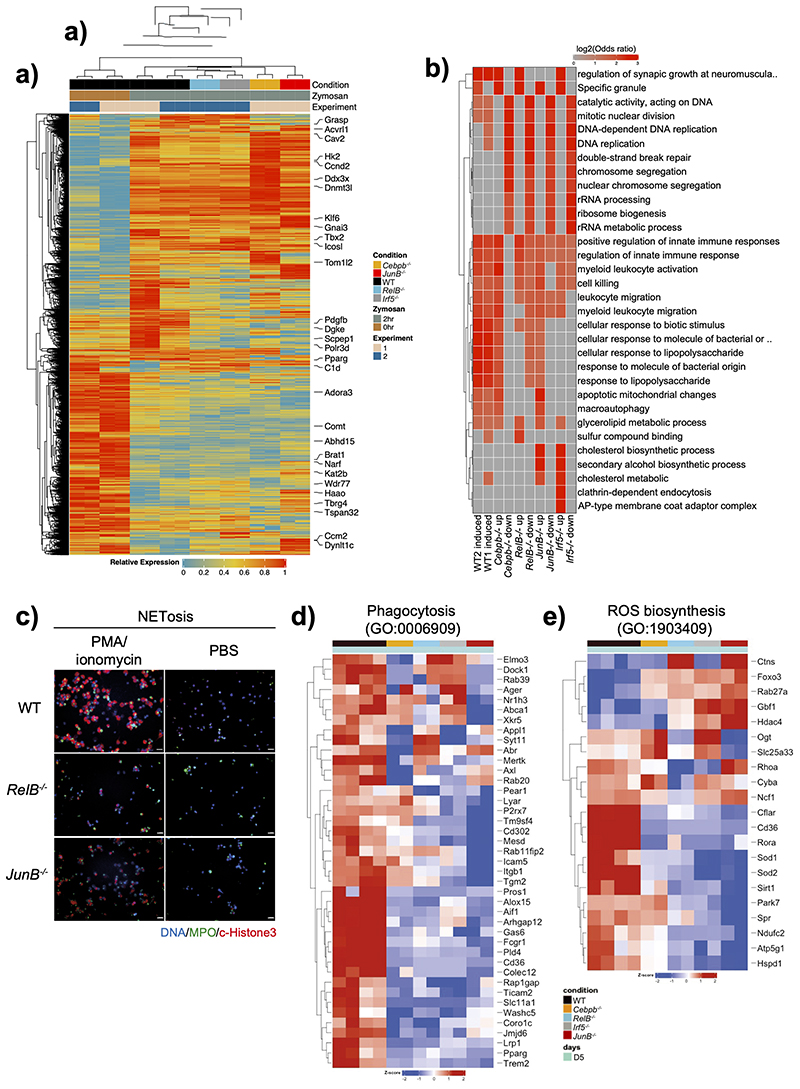
Extended Data Fig. 8. RELB, IRF5, and JUNB deficiency impair neutrophil inflammatory responses.
a) Hierarchical clustering of all DEGs (padj < 0.05, |log2FC|>1). Data are presented as heatmap normalized to the minimum and maximum of each row.
b) Gene ontology (GO) analysis showing the log2 odds ratio of genes regulated by specific TF knockout with the indicated GO annotation.
c) Representative immunofluorescence images of NETosis from WT, RelB–/– and JunB–/– HoxB8 neutrophils stimulated with 5μM ionomycin and PMA overnight, stained for DNA (blue), MPO (green) and citrullinated histone3 (red). Representative images from three independent experiments are shown. Scale bar indicates 10μm.
d) Phagocytosis-related gene expression in in Cebpβ–/–, RelB–/–, Irf5–/– or JunB–/– HoxB neutrophils.
e) ROS-biosynthetic-process-related gene expression in WT, Cebpβ–/–, RelB–/–, Irf5–/– or JunB–/– HoxB8 neutrophils.

