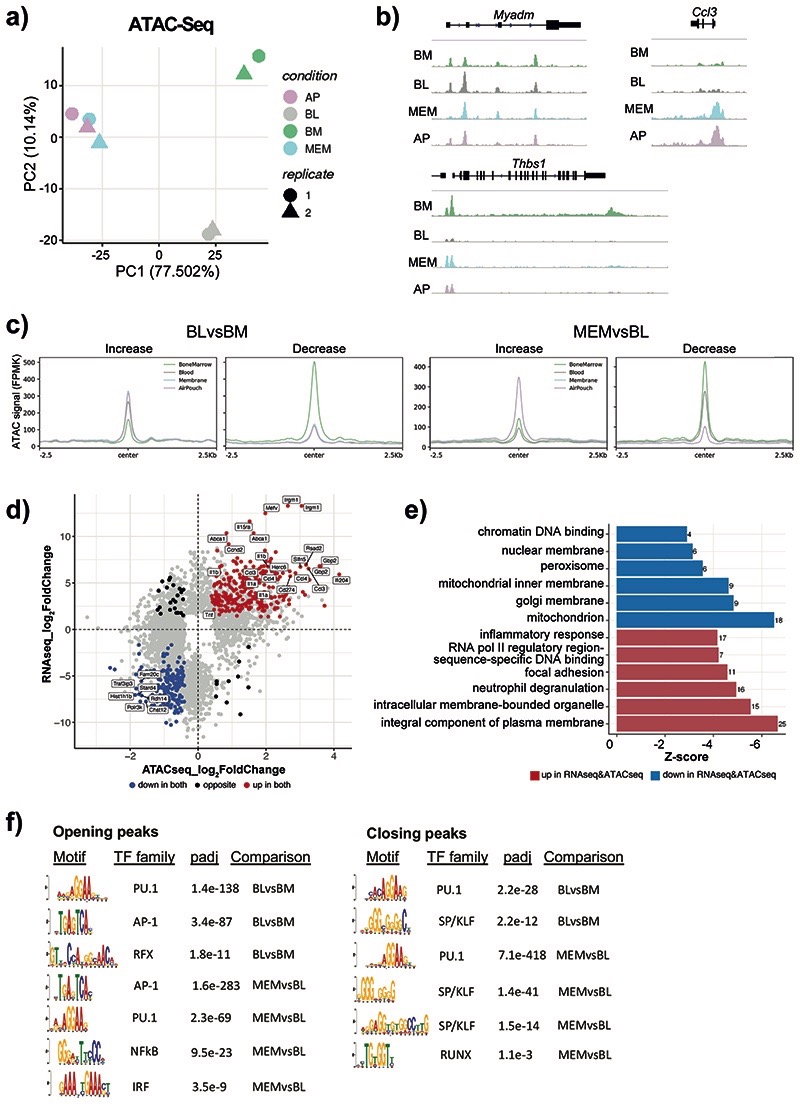
Fig. 2. Neutrophils dynamically alter their chromatin landscape en route to the site of inflammation.
a) ATAC-Seq analysis was conducted on Ly6Ghi CD11b+ cells sorted from the BM, blood, membrane, and air pouch exudate in mice subjected to air pouch model and zymosan challenge for 4 hours. ATAC-Seq peak calling with MACS2 revealed 47,164 peaks detected across all four neutrophil stages. Principal component analysis (PCA) of 11,881 differentially accessible ATAC-Seq peaks derived from ATAC-seq analysis (n=50,000 cells/samples) of neutrophils isolated from the bone marrow, blood, membrane and exudate of two mice subjected to the air pouch model and zymosan challenge.
b) Representative snapshots of normalised read counts (FPKM) at gene loci.
c) Distribution histogram of differentially accessible ATAC-seq peaks over 2.5 kb regions centered on the peaks in neutrophils from different compartments.
d) Intersection of RNA-seq and ATAC-seq data: genes which are both upregulated and located in the regions of opening ATAC-Seq peaks (increased chromatin accessibility) (as in Fig. 2b) are highlighted in red, genes which are both downregulated and located in the regions of closing ATAC-Seq peaks (decreased chromatin accessibility) are highlighted in blue.
e) Gene ontology analysis of genes that are differentially expressed and located in differentially accessible regions (as in Fig. 2c). The top 6 gene ontology terms for upregulated genes with opening peaks (red) and downregulated genes with closing peaks (blue) are shown.
f) De novo motif enrichment analysis for ATAC-Seq peaks increasing (left) and decreasing (right) in accessibility using MEME-ChIP. Numbers indicate adjusted p values.

