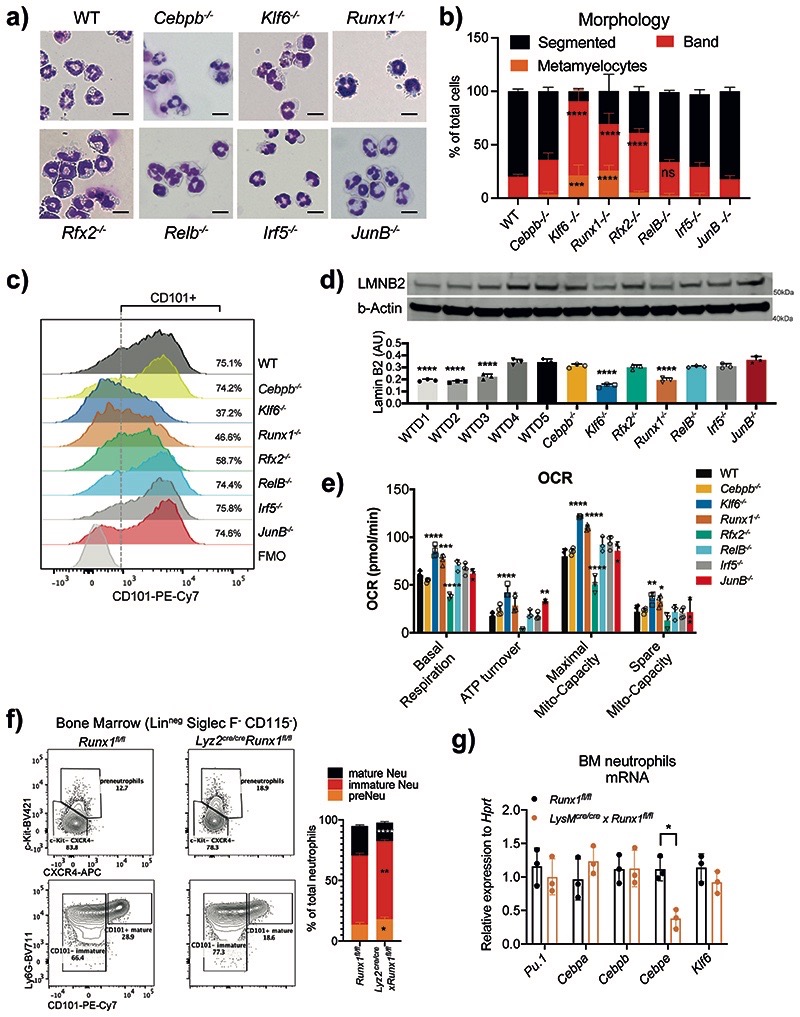
Fig. 3. RUNX1 and KLF6 deficiency impairs the maturation of neutrophils.
a) Morphology assessment of WT and indicated KO HoxB8 neutrophils differentiated for 5 days. Scale bar represents 10μm. Representative images from three independent experiments are shown.
b) Quantification of different maturation stages in WT and TF-deficient HoxB8 neutrophils as in A). The results are expressed as percentages of segmented, band neutrophils and metamyelocyte, and at least 200 cells counted from different fields. Data are shown as means and SD from three independent experiments. Significant differences compared with the WT control group are denoted as: ns, not significant, **P<0.01, ***P<0.001, and ****P<0.0001; (two-way ANOVA with Dunnett’s multiple comparisons test).
c) Differential expression of CD101 in HoxB8 neutrophils differentiated for 5 days. Data are shown as a representative of three independent experiments.
d) Lamin-B2 (LMNB2) expression in HoxB8 neutrophils. Top: one representative Western blot probed for LMNB2 and b–Actin is shown. Bottom: The arbitrary units of LMNB2 expression normalized to b–Actin amount are calculated and shown as means and SD from three independent experiments. Significant differences compared with WT cells are denoted as: ****P<0.0001; (Oridinary one-way ANOVA with Dunnett’s multiple comparisons test).
e) Oxygen consumption rate (OCR) of WT and indicated KO HoxB8 neutrophils. Data are shown as means and SD from three independent experiments. Significant differences compared with WT day5 neutrophils are denoted as: *P<0.05, **P<0.01, ***P<0.001, and ****P<0.0001; (Oridinary two-way ANOVA with Turkey’s multiple comparisons test).
f) Runx1 deficiency affects neutrophil maturation in vivo. Left: representative scatter plot of neutrophil subsets from Runx1fl/fl and Lyz2Cre/cre xRunx1fl/fl mice. Right: Statistical analysis of percentages of indicated neutrophil subsets.
g) Pu.1, Cebpa, Cebpb, Cebpe and Klf6 mRNA expression in CD11b+ Ly6G+ neutrophils sorted from Runx1fl/fl and Lyz2Cre/cre xRunx1fl/fl mice.
f, g) Data are shown as means and SD derived from three mice. Significant differences compared with WT mice are denoted as: *P<0.05, **P<0.01, ***P<0.001, ****P<0.0001; (RM two-way ANOVA with Šidák’s multiple comparisons test).

