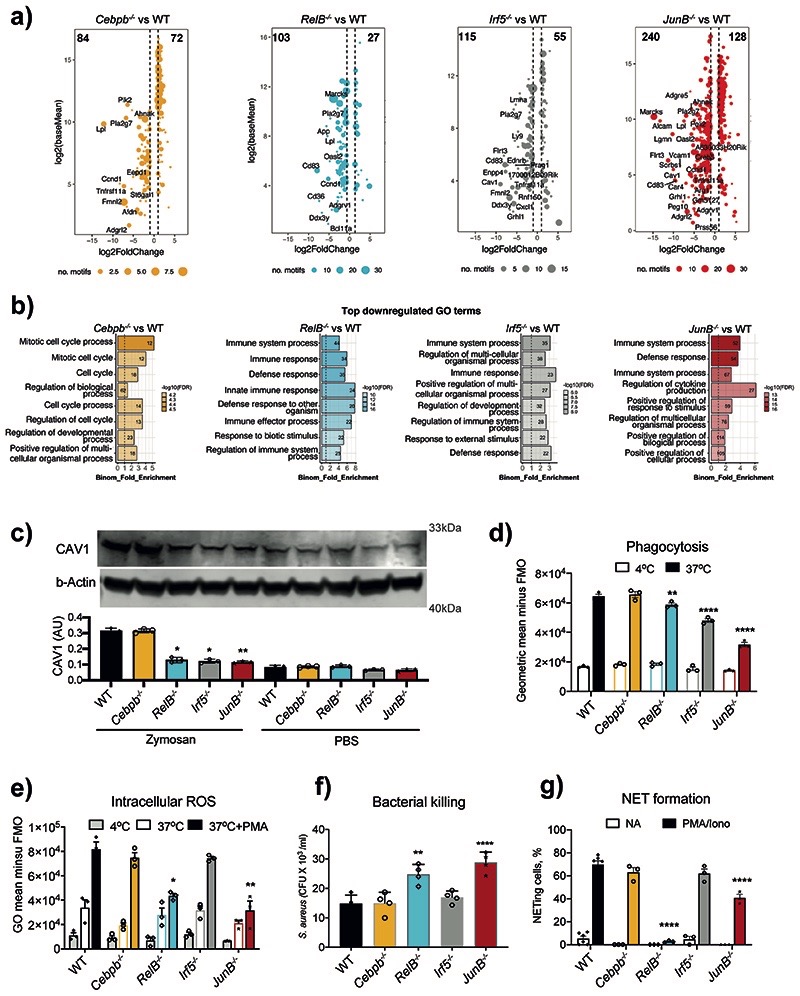
Fig. 5. RELB, IRF5 and JUNB control immune responses of neutrophils.
a) Putative “target genes” for each TF: differentially expressed genes (HoxB8 WT vs TF KO in zymosan-induced HoxB8 neutrophils, padj < 0.05, fold change > 2) stratified by the identified binding sites for corresponding TFs (FIMO p-value < 0.0001) within differentially accessible ATAC-seq peaks (padj < 0.05, fold change > 1.5) in gene vicinity.
b) GO biological-process terms enriched for putative “target genes” (as in Fig. 5a).
c) Caveolin-1 (CAV1) expression in HoxB8 neutrophils. Top: one representative Western blot probed with antibodies specific for CAV1 and b–Actin is shown. Bottom: statistical analysis of Cav1 expression normalized against b–Actin amount in the lysates (and expressed as arbitrary unit of CAV1). Data are shown as means and SD from three independent experiments. Significant differences compared with the unstimulated WT neutrophils are denoted as: *P<0.05, **P<0.01; (Oridinary one-way ANOVA with Dunnett’s multiple comparisons test).
d) Phagocytosis of fluorescein conjugated E. coli by WT and indicated KO HoxB8 neutrophils, measured by flow cytometry.
e) Intracellular ROS production by WT and indicated KO HoxB8 neutrophils.
f) Bacterial killing by HoxB8 neutrophils incubated with Staphylococcus aureus (S. aureus) for 90 minutes before cell lysis. Values represent absolute CFU counts generated by surviving bacteria. Data are shown as means and SD derived from four independent experiments.
g) NET formation in response to stimulation by PMA/Ionomycin in WT and indicated KO HoxB8 neutrophils. The data are expressed as percentages of neutrophils undergoing NETosis out of at least 200 cells counted from different fields and independent replicates. Data are shown as means and SD derived from three independent experiments.
d, e, g) Significant differences compared between KO and WT neutrophils are denoted as: *P<0.05, **<0.01, ***<0.001, ****P<0.0001; (DM one-way ANOVA with Dunnett’s multiple comparisons test).

