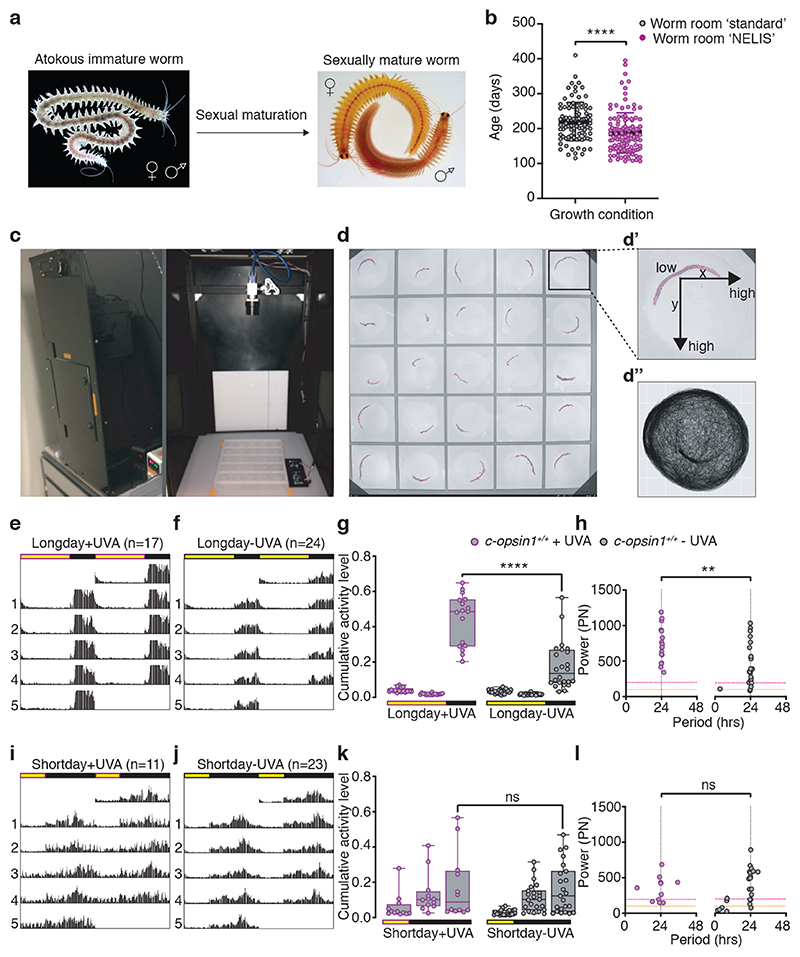
Figure 2. UVA/deep violet light affects locomotor behavior in Platynereis dumerilii.
(a) sexual maturation in Platynereis dumerilii. (b) Platynereis wildtype worms grown under spectral conditions mimicking sunlight (“NELIS” culture, Extended Data Fig.4b,b’) mature significantly faster than sibling worms reared under wormroom ‘standard’-white light (Extended Data Fig.4a), Mann-Whitney U test. Worm density and feeding was as similar as possible for both conditions. Worms were scored mature when exhibiting the mature appearance and exhibited the characteristic “nuptial dance” behavior. (c) Platynereis behavioral recording chamber (51cm x 51cm x 101cm) with broad spectrum lighting system, IR-camera and IR-light. Real time light intensity and temperature were recorded during experiment by light/temperature detector positioned next to the behavioral grid. (d) Behavioral grid with worms tracked by ‘Motif’, an automated worm tracking software developed to detect individual experimental worms (magenta contour outline). (d’) The individual distance moved is calculated from the mid-point of the detected shape in relation to the xy-pixel coordinates in subsequent frames. (d”) Exemplary movement plot of an immature worm recorded and tracked for 10 days. (e,f) Double plotted average actograms of c-opsin1+/+ worms under long day including UVA (e: n=17) and long day filter-reduced UVA (f: n=24). (g) c-opsin1+/+ worms recorded in (f) show significantly decrease locomotor activity compared to (e) (One-way ANOVA, Sidak’s multiple comparison test) and (h) a significant decrease in power (PN) and rhythmicity (Lomb-Scargle periodogram test, Mann-Whitney-Wilcoxon test). Rhythmic strength thresholds were manually annotated: PN≥200 – rhythmic (above magenta dotted line), PN≤100 – arrhythmic (below orange dotted line) and PN>100<200 – weakly rhythmic. (i,j) Double plotted average actograms of c-opsin1+/+ worms under short day including UVA (i, n=11) and short day filter-reduced UVA (j, n=23). (k,l) c-opsin1+/+ worms recorded in (i,j) showed no difference in locomotor activity level (k) and rhythmicity (l). *p<0.05, ** p<0.01, *** p<0.001. Full statistical analyses: Supp.Fig. 7. Locomotor data of individual worms: Supp.Figs 2a,4a,5a,6a. Individual worm rhythm period and power were determined via Lomb-Scargle periodograms using ActogramJ.

