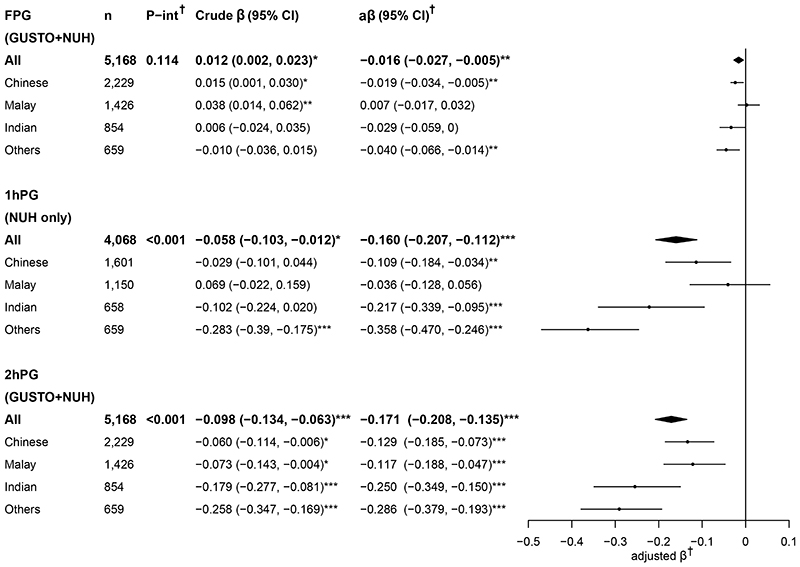
Figure 2. Crude and adjusted beta coefficients of plasma glucose (mmol/L) associated with height (per-5cm increment) among all women and when stratified by ethnic groups.
†Adjusted for maternal age, booking weight (and ethnicity for “All” women analyses).
P-interaction denotes the P value for the interaction effects between height and ethnicity on plasma glucose.
*P<0.05; **P<0.01; ***P<0.001.
1hPG, 1-h plasma glucose; 2hPG, 2-h plasma glucose; aβ, adjusted beta coefficient; FPG, fasting plasma glucose; P-int, P-interaction

