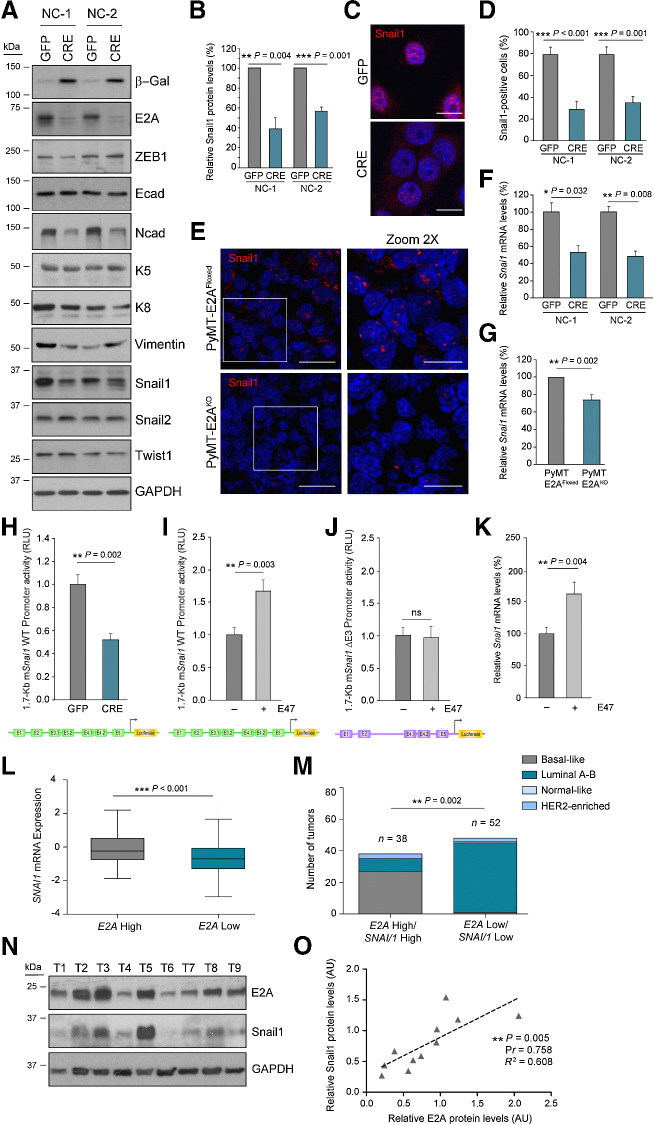
Figure 5.
E2A proteins regulate Snail1 expression in breast tumors. A, Representative immunoblots of the indicated EMT markers in two independent PyMT-neoplastic cell lines. GAPDH was used as loading control. B, Quantification of Snail1 protein levels in PyMT cell lines. Data are expressed relative to control NC-GFP cells and represent the mean ± SEM of four independent experiments. C and D, Representative confocal microscopy images (C) and percentage (D) of NC-GFP or NC-CRE cells positive for nuclear Snail1 stain. Nuclei were counterstained with DAPI (blue; C). Scale bar, 10 μm. Results in D correspond to the mean ± SEM of three independent experiments; n = 80–100 cells analyzed per experiment. E, Representative confocal microscopy images of nuclear Snail1 detection in PyMT-E2AFloxed and PyMT-E2AKO tumors (14 weeks old). Magnifications correspond to the boxed areas. Nuclei were counterstained with DAPI (blue). Scale bars, 20 μm and 10 μm (magnification). n = 6 tumors per genotype. F and G, qRT-PCR analyses of relative Snai1 mRNA levels in NC cells (F) and primary luminal cells (G). Data are expressed relative to corresponding controls and represent the mean ± SEM; n = 4 (F) and n = 6 (G) independent cell preparations. H, Relative activity of 1.7-Kb mSnai1 WT promoter in NC-GFP and NC-CRE cells. Data represent the mean ± SEM of four independent experiments. I and J, Relative activity of mSnai1 WT (I) and ΔE3 (J) promoters in NC-GFP cells in the presence or absence of ectopic mE47. Data represent the mean ± SEM of five independent experiments. K, qRT-PCR analysis of endogenous Snai1 mRNA levels in NC-GFP cells in the absence or presence of mE47. Data show the mean ± SEM of three independent experiments. L, Tukey style boxplot showing SNAI1 expression in human IDBC plotted against normalized E2A mRNA levels (first vs. third quartile, n = 125 tumors to each category; TCGA dataset). M, Tumors analyzed in L stratified for normalized E2A and SNAI1 mRNA levels (first vs. third quartile, n = 38 and n = 52, respectively) and classified according to their PAM50 subtype. N, Immunoblot of E2A and SNAIL1 in a representative cohort of human basal-like breast tumors (n = 9). GAPDH was used as a loading control. O, Correlation between E2A and SNAIL1 relative protein levels in human tumors represented in N plus additional samples (n = 11). Correlation between E2A and SNAI1 mRNA (L) and protein expression (O) was done by linear regression analysis and Pearson R coefficient (Pr). Association of high E2A/SNAI1 mRNA expression with PAM50 tumor subtype (M) was calculated by multiple testing using the FDR. Additional statistical analyses were performed by two-sided unpaired Student t test. ns, not significant.

