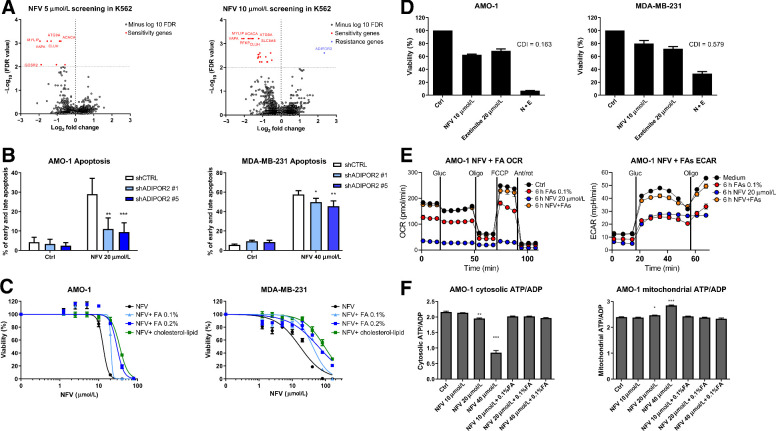
Figure 4.
CRISPR/Cas9 library screening suggests involvement of ADIPOR2 and fatty acids in the resistance to nelfinavir and consequently modulation of fatty acids changes nelfinavir-induced effects on cell viability and energetics. A, Genome-wide CRISPR/Cas9 library screening in K562 cells with 5 and 10 μmol/L nelfinavir identified candidate genes involved in nelfinavir sensitivity (red) or in nelfinavir resistance (blue) at the cutoff value of −log10 FDR = 2. For a detailed list of the sensitivity and resistance candidate genes, their log-fold change over the DMSO-treated cells, and FDR value, see Supplementary Table S7A and S7B. B, Apoptosis rate evaluated 24 hours after treatment with 20 μmol/L nelfinavir in the AMO-1 and MDA-MB-231 cells with decreased ADIPOR2 expression. For the efficacy of ADIPOR2 silencing in the two cell lines, see Supplementary Fig. S8. C, Dose response curves of cell lines exposed to increasing doses of nelfinavir alone or in combination with fatty acid (FA) supplement or cholesterol–lipid concentrate. For the cytotoxicity of increasing doses of FA supplement alone, see Supplementary Fig. S9A. D, Cytotoxicity of nelfinavir (N), ezetimibe (E), and their combination (N+E) in AMO-1 and MDA-MB-231 cell lines. For the cytotoxicity of nelfinavir (N), ezetimibe (E), and their combination (N+E) in the presence of 0.1% FA supplement or cholesterol–lipid concentrate, see Supplementary Fig. S9B and S9C. E, OCR (left) and ECAR (right) in AMO-1 cells 6 hours after treatment with 20 μmol/L nelfinavir, 0.1% FA supplement, or their combination. F, Assessment of the cytoplasmic (left) and mitochondrial (right) ATP/ADP ratio in AMO-1 cells 6 hours after treatment with increasing concentrations of nelfinavir (10, 20, and 40 μmol/L) alone or in combination with 0.1% FA supplement. In all experiments, viability was assessed 48 hours after continuous treatment. For the drug combinations, coefficient of drug interaction was calculated. Data of viability assays, flow cytometry, and Seahorse analysis represent a mean ±SD from three replicates and statistically significant differences are marked. *, P < 0.05; **, P < 0.01; ***, P < 0.001.

