Figure 5.
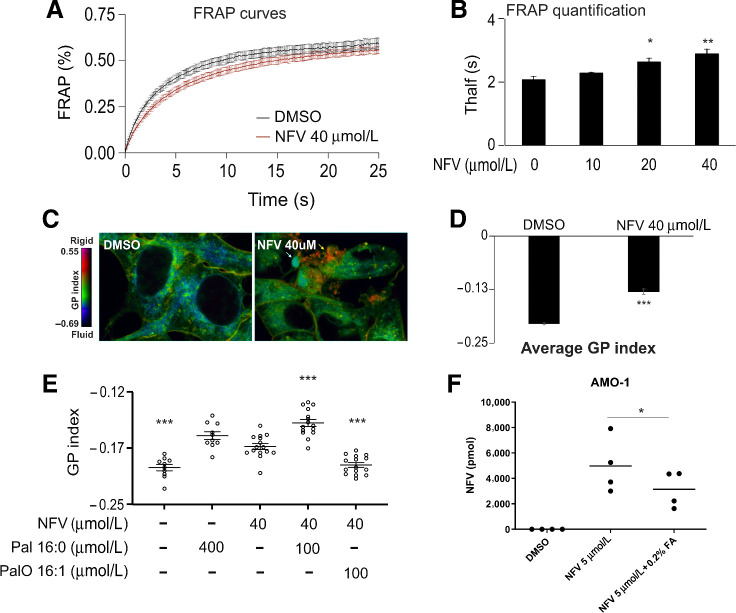
Nelfinavir increases membrane rigidity, which can be reverted by unsaturated FA. A, FRAP results in HEK293 cells challenged with 40 μmol/L nelfinavir for 6 hours. Data of a representative experiment with n = 15–18. B, Quantification of a FRAP experiment in HEK293 treated with increasing concentrations of nelfinavir for 6 hours. Average Thalf values, the time by which half of the maximum fluorescence recovery is reached. Data of a representative experiment with n = 5–15. C, Pseudocolor images showing the laurdan dye GP index at each pixel position in HEK293 cells challenged with 40 μmol/L nelfinavir for 6 hours. Yellow arrow, a spot with very strong rigidity. D, Average GP index from several images as depicted in C (n = 15–19). E, Average GP index from several images of the laurdan dye staining in U-2 OS cells challenged with 40 μmol/L nelfinavir alone or in combination with saturated (Pal) or unsaturated (PalO) FA for 6 hours. For the pseudocolor images showing the laurdan dye staining in U-2 OS cells, see Supplementary Fig. S10A. For the effect of bortezomib and carfilzomib on membrane fluidity, see Supplementary Fig. S10C. F, Intracellular nelfinavir assessment upon treatment of AMO-1 cells for 6 hours with 5 μmol/L nelfinavir alone or in combination with 0.2% FA supplement. *, P < 0.05; **, P < 0.01; ***, P < 0.001.

