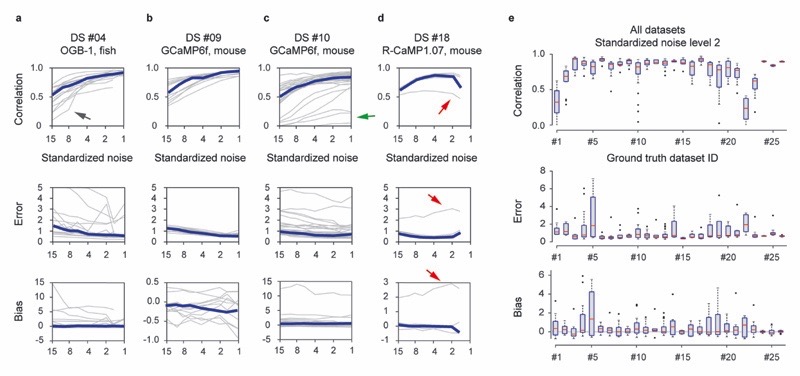
Extended Data Fig. 4. Generalization across neurons within a dataset.
The deep network was trained on all neurons of a specific dataset except one, and then tested with the remaining neuron. This analysis shows how the network is able to generalize to new neurons recorded under the same conditions, as a function of the standardized noise level v in % · Hz −1/2. a-d, Performance of the predictions for 4 selected ground truth datasets in terms of correlation, error and bias as a function of the standardized noise level. Error values were cropped at a value of 5 for display purposes. Single neurons in grey, median across neurons in blue. Grey lines highlighted by arrows indicate outlier neurons with particularly low spike rates (black and green arrows) and particularly distinct calcium response kernel (red arrow, see main text for discussion). e, Correlation, error and biases as a distribution across neurons within each dataset (number of neurons for each dataset as indicated in Table 1). For box plots, the median is indicated by the central line, 25th and 75th percentiles by the box, and maximum/minimum values excluding outliers (points) by the whiskers. All datasets were re-sampled at a frame rate of 7.5 Hz.

