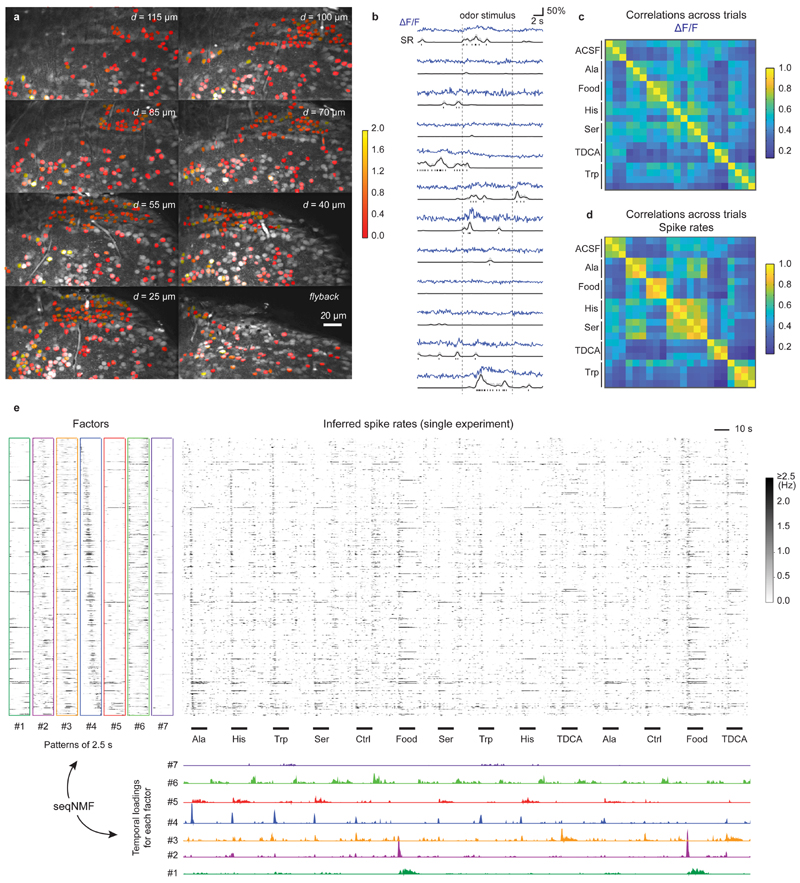
Figure 5. Inference of spiking activity with CASCADE from population calcium imaging across >1100 neurons in adult zebrafish.
a, Multiple planes were imaged simultaneously. Similar results have been obtained in 21 fish. The ROIs are colored with the average number of inferred stimulus-evoked spikes (colorbar). Non-active neurons were left uncolored. b, Randomly selected examples of calcium traces (ΔF/F, blue), inferred spike rates (SR, black) and inferred discrete spikes, highlighting the de-noising through spike inference. c, Correlation of odor-evoked responses across trials, based on ΔF/F data during the initial 2.5 s of the odor response. d, Correlation of odor-evoked responses across trials, based on inferred spiking probabilities. e, Unsupervised detection of sequential factors (left) and their temporal ‘loading’ (bottom), shown together with the inferred spiking probabilities (center) across a subset of stimulus repetitions. The temporal loadings indicate when a given factor becomes active. All neurons were ordered according to highest activity in pattern #4, highlighting the sequential activity pattern that is evoked by stimuli at multiple times.

