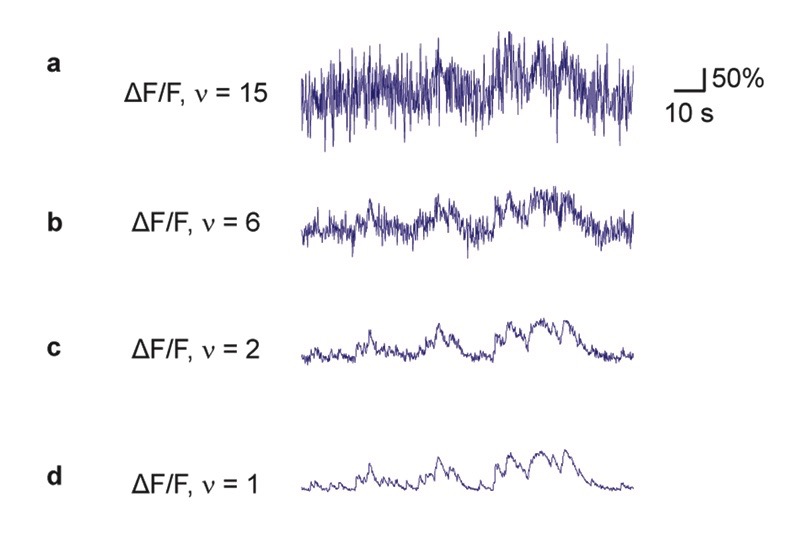
Extended Data Fig. 2. Illustration of different baseline noise levels.
ΔF/F ground truth traces were resampled with added noise to reach the target noise level v. a-d, Noise level illustration from v = 15 (very high noise level) to v = 1 (very low noise level). Standardized noise v is given in units of % · Hz −1/2.

