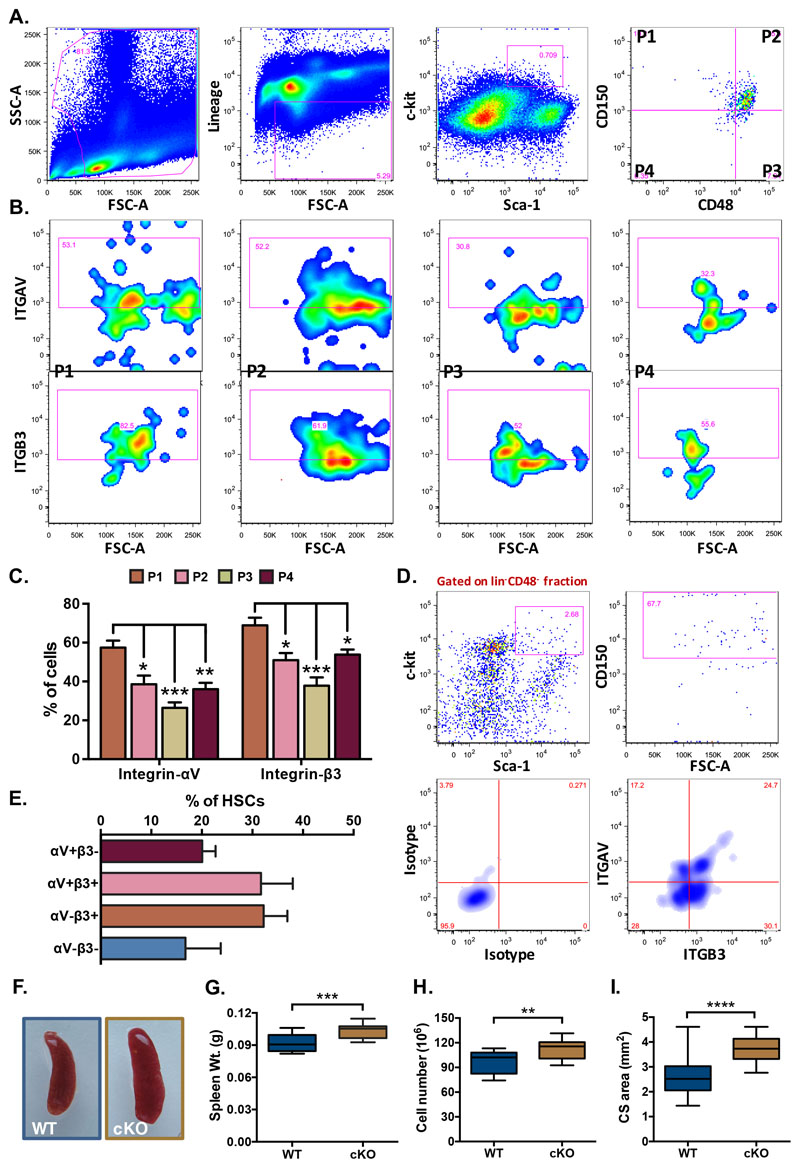
Figure 3. Expression of ITGAV and ITGB3 in hematopoietic stem cell sub-populations in spleen.
Adult spleen derived MNCs were analyzed for the cell surface expression of ITGAV and ITGB3 on various HSC sub-populations by flow cytometry. (A) The LSK population from the spleen MNCs was further divided into four sub-populations on the basis of expression of SLAM markers CD150 and CD48. (B) All four sub-populations of the LSK cells were examined for the expression of ITGAV (upper panel) and ITGB3 (lower panel), separately. (C) Comparison of ITGAV and ITGB3 expression on different HSC sub-populations. Proportion of each LSK sub-population based on CD150 and CD48 that expressed ITGAV or ITGB3 was plotted. One-way ANOVA followed by Tukey-Kramer Post Hoc test was performed * p<0.05, ** p<0.01. (D) Co-expression analysis of ITGAV and ITGB3 on the primitive HSCs. The adult spleen derived HSCs were identified as lin-CD48-c-kit+Sca-1+CD150+ cells and were examined for the expression of ITGAV and ITGB3 based on flow cytometry. (E) Proportion of primitive HSCs expressing ITGAV and ITGB3 in combination or separately. (F) Gross morphology of the spleen from Vav-Itgav+/+ (WT) and Vav-Itgav-/- (conditional knockout; cKO) mice obtained following crossing Vav-iCre and Itgavfl/fl lines. (G) Comparison of whole spleen weight from WT and cKO mice. (H) Comparison of total spleen cellularity (total mononuclear cells) in the WT and cKO mice. (I) Cross-sectional area quantified using transverse sections through the spleen tissues. Six 10μm thick sections (every fifth section used for analysis), were analyzed for total cross-sectional area. n=4, N=24, * p<0.05, ** p<0.01, *** p<0.001, **** p<0.0001, ns indicates not significant.

