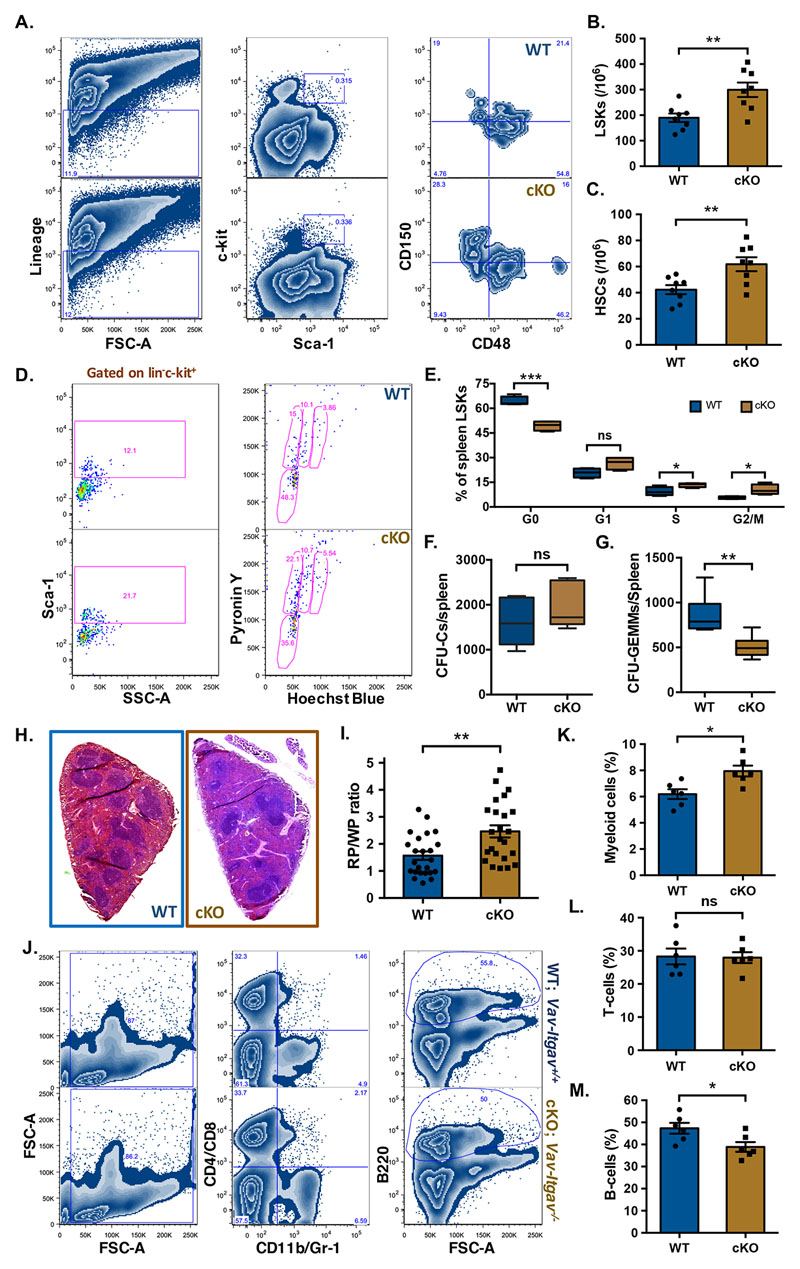
Figure 4. Increased frequency of phenotypic HSCs and poor B-lymphopoiesis in Vav-Itgav-/- spleen.
(A-C) Mononuclear cells from Vav-Itgav+/+ (WT), Vav-Itgav-/- (cKO) spleen tissues were used for the analysis of HSC frequency by flow cytometry. Quantification of frequency of hematopoietic stem and progenitor cell populations in the spleen from WT and cKO mice; (A) The LSK population from the spleen MNCs was further divided on the basis of expression of SLAM markers CD150 and CD48, (B) LSK cells, (C) primitive HSCs (n=8). (D,E) Cell cycle analysis of the primitive HSCs population from spleen by Hoechst 33342/Pyronin Y staining. Comparison of the proportion of spleen LSK cells in various stages of cell cycle is shown (n=6). (F,G) CFU-C assay performed on total splenocytes to compare the frequency of hematopoietic progenitors. Total number of CFU-Cs (F) and CFU-GEMMs (G) were compared between WT and cKO mice (n=6). (H) Spleen tissues from Vav-Itgav+/+ (WT) and Vav-Itgav-/- (cKO) animals were harvested. The formalin-fixed, paraffin-embedded tissues were used to cut 10μm sections that were used for H&E staining. (I) The ratio between the cross-sectional area under red pulp (RP) and white pulp (WP) was compared between WT and cKO spleen tissues (n=4, N=24). (J-M) Mononuclear cells harvested from WT and cKO spleen tissues were used for flow cytometry analysis. The proportion of CD11b/Gr-1+ myeloid cells (K), CD4/CD8+ T-cells (L) and B220+ B-cells (M) was compared between WT and cKO mice derived spleen tissues (n=6).
Unpaired two-tailed Student’s t-test was performed. * p<0.05, ** p<0.01, *** p<0.001, ns indicates not significant.

