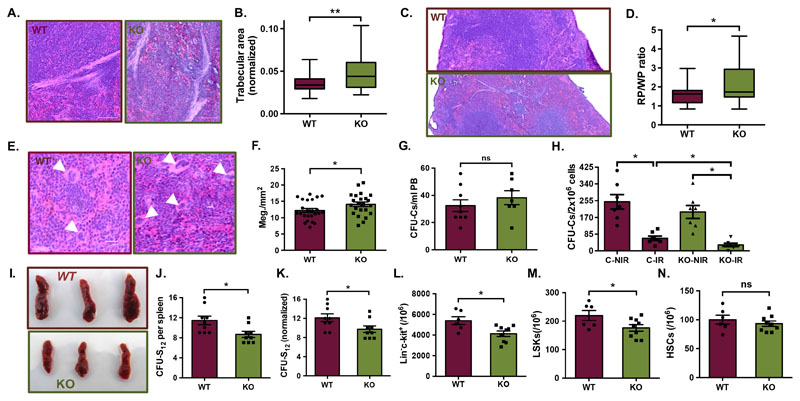
Figure 6. Postn deletion leads decline in spleen lympho-hematopoietic function.
(A-D) Histological examination of spleen tissue sections from Postn+/+ (WT) and Postn-/- (KO) mice. Tissues fixed in 4% paraformaldehyde were cut into 10μm sections and H&E staining was performed. Brightfield images were captured for histological analysis. (A) Examination of the trabecular area by H&E staining. (B) Quantification of trabecular area as proportion of the total cross-sectional area of spleen tissues from WT and KO mice. (C) H&E stained sections analyzed for spleen cross-sectional area under red and white pulp. (D) Comparison of the ratio of red versus while pulp in the spleen tissues from WT and KO mice. n=4, N=23-24
(E) Histological examination of the WT and KO spleen sections to identify megakaryocytes (white arrowheads) on the basis of morphological features. (F) Comparison of megakaryocyte frequency in spleen sections per mm2 of the total cross-sectional area. n=4, N=24, unpaired two-tailed Student’s t-test was performed, * p<0.05, ** p≤0.01, ns indicates not significant.
(G) Methylcellulose-based colony assay performed to quantify HSPCs in peripheral blood of WT and KO mice. n=7, unpaired two-tailed Student’s t-test, ns indicates not significant (p>0.05).
(H) Postn+/+ (C) and Postn-/- (KO) mice with (IR) or without (NIR) radiation injury compared for HSPC frequency, using methylcellulose-based colony assay. Colony assays were performed one week after radiation injury and colonies were counted after 12 days. n=2, N=7 unpaired two-tailed Student’s t-test, * p<0.05
(I) CFU-S12 assay performed to assess the support potential of splenic niche for the incoming hematopoietic progenitors. Overall morphology of the WT and KO spleen tissues, 12 days after the mice received WT BM cells following lethal dose of irradiation.
(J) Comparison of the total number of spleen colonies in recipient WT and KO mice from CFU-S12 assay.
(K) Comparison of the number of spleen colonies in WT and KO mice following normalization with the spleen weight.
(L-N) Flow cytometry analysis of spleen MNCs for comparison of the HSC sub-populations in spleen, following CFU-S12 assay. Quantification of the frequency of various hematopoietic stem and progenitor cell populations in the spleen from WT and KO mice; (L) lin-c-kit+ cells, (M) LSK cells, (N) primitive HSCs.
Unpaired two-tailed Student’s t-test was performed. n=3, N=9, t test: * p<0.05, ns indicates not significant.

