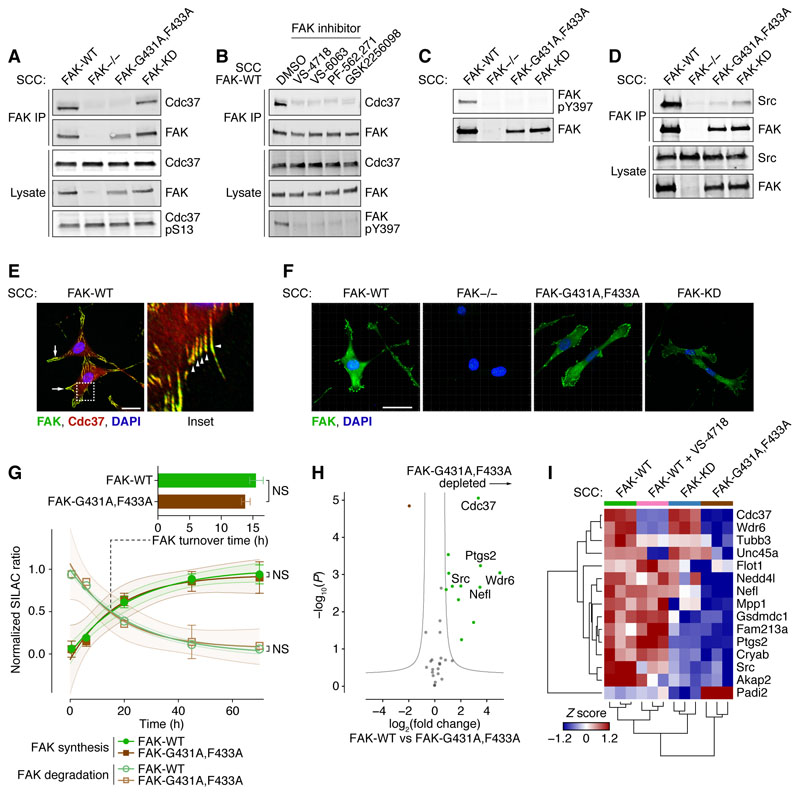
Figure 1. Disruption of Cdc37 chaperone binding to FAK mimics FAK kinase inhibition.
A, IP of FAK from SCC FAK-WT, FAK−/−, FAK-G431A,F433A, and FAK-KD cell lysates, immunoblotted for FAK, Cdc37, and phosphorylated Cdc37 (S13). B, IP of FAK from SCC FAK-WT cells treated with DMSO (0.1%) or 250 nM VS-4718, VS-6063, PF-562,271, or GSK2256098 for 24 h, immunoblotted for FAK, phosphorylated FAK (Y397), and Cdc37. C, Lysates from SCC FAK-WT, FAK−/−, FAK-G431A,F433A, and FAK-KD cells, immunoblotted for FAK and phosphorylated FAK (Y397). D, IP of FAK from SCC FAK-WT, FAK−/−, FAK-G431A,F433A, and FAK-KD cell lysates, immunoblotted for FAK and Src. E, SCC FAK-WT cells seeded on glass coverslips, fixed, and labeled with anti-FAK (green), anti-Cdc37 (red), and DAPI (blue). Inset (right) represents dashed boxed region of main image. Arrows and arrowheads (inset) indicate examples of regions of colocalization of FAK and Cdc37. Scale bar, 20 μm. F, SCC FAK-WT, FAK−/−, FAK-G431A,F433A, and FAK-KD cells seeded on glass coverslips, fixed, and labeled with anti-FAK (green) and DAPI (blue). Scale bars, 20 μm. G, FAK synthesis and degradation profiles quantified by metabolic labeling and mass spectrometry. FAK-WT (green) and FAK-G431A,F433A (brown) synthesis and degradation curves were determined from normalized SILAC ratio profiles by nonlinear regression and plotted as means ± SEM with best fit curves and 95% confidence interval bands (n ≥ 5 peptides; representative of three independent experiments). NS, not significant (extra sum-of-squares F test). Bar chart inset summarizes inferred 50% protein turnover times for FAK-WT and FAK-G431A,F433A, plotted as means ± SD (n = 3 independent experiments). NS, not significant (two-tailed Mann–Whitney U test). H, Label-free mass spectrometric characterization of FAK-interacting proteins isolated by IP of FAK from SCC FAK-WT and FAK-G431A,F433A cell lysates. Specific FAK-binding proteins were determined versus IP from SCC FAK−/− cells (n = 3 independent experiments), satisfying Q < 0.05 (Student’s t-test with permutation-based FDR correction). Gray curves show the threshold for significant differential regulation (FDR, 5%; artificial within-groups variance, 1). Proteins satisfying P < 0.01 and fold change > 4 are labeled with gene names for clarity. I, Label-free mass spectrometric characterization of FAK-interacting proteins isolated by IP from SCC FAK-WT, FAK-KD, and FAK-G431A,F433A cell lysates and lysates from SCC FAK-WT cells treated with 250 nM VS-4718 (n = 3 independent experiments). Normalized label-free quantification of protein abundance for each protein was converted to a Z score. Differentially regulated, specific FAK-binding proteins satisfying Q < 0.05 (one-way ANOVA with permutation-based FDR correction) were hierarchically clustered and displayed as a heatmap. Proteins are labeled with gene names for clarity.

