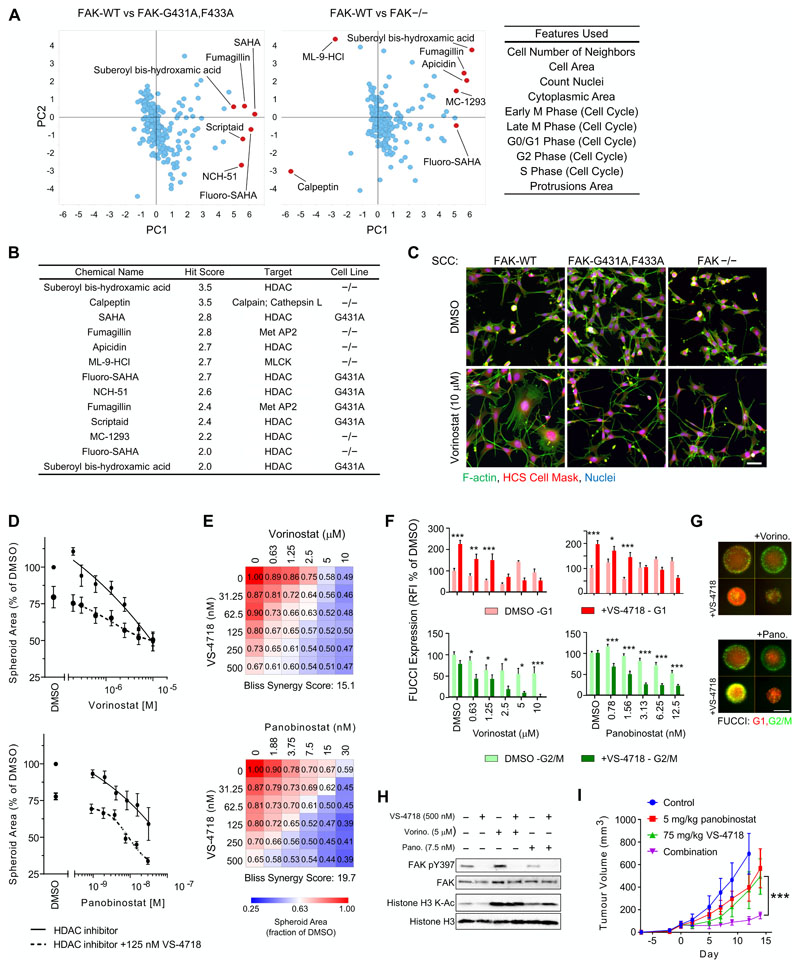
Figure 2. Identification of synergistic combinations with FAK kinase inhibitors.
A, Summary of compound screen to identify drug sensitivity in the presence of reduced FAK kinase activity. To identify differential phenotypic effects between FAK-WT and FAK-mutant (FAK-G431A,F433A or FAK−/−) cells, for each image-based measurement Z-score, the FAK-WT value was subtracted from each FAK mutant value. Differential phenotypic effects were analyzed by principal component analysis. Principal components (PCs) 1 and 2 account for 51.3% and 22.1% of the total variance, respectively. Cellular features used in the phenotypic analysis are listed in the inset (right). B, Hit compounds identified in the phenotypic screen. Vorinostat is labeled as SAHA in A and B. C, SCC FAK-WT, FAK-G431A,F433A, and FAK−/− cells treated with 10 μM vorinostat. Blue, nuclei; green, F-actin; red, HCS Cell Mask. Scale bar, 50 μm. D, Combination of vorinostat (top) or panobinostat (bottom) with VS-4718 inhibits spheroid growth. E, Dose matrices of spheroid area following treatment with vorinostat (top) or panobinostat (bottom) in combination with VS-4178 for 7 days. F, Quantification of RFP (G1 phase; top) and GFP (G2/M phase; bottom) FUCCI cell cycle reporter expression in SCC FAK-WT spheroids treated with vorinostat (left) or panobinostat (right) for 7 days. For combination treatments with VS-4718, 500 nM VS-4718 was used. RFI, relative fluorescence intensity. G, SCC FAK-WT spheroids expressing FUCCI cell cycle reporter were treated for 7 days with vorinostat (Vorino.; 1.25 μM) or panobinostat (Pano.; 6.25 nM) in combination with VS-4718 (500 nM). For D, E, and F, data are normalized to DMSO values and are displayed as means ± SEM (n = 3 independent experiments). *, P < 0.05; **, P < 0.01; ***, P < 0.001 (two-way ANOVA). H, Lysates from SCC FAK-WT spheroids treated with VS-4718, vorinostat (Vorino.), or panobinostat (Pano.) for 24 hours and immunoblotted for FAK, phosphorylated FAK (Y397), histone H3, and acetylated (K-Ac) histone H3. I, Combination of panobinostat and VS-4718 inhibits SCC FAK-WT tumor growth. Mice were treated with drug(s) from day 0. Group tumor volumes are displayed as mean ± SEM [n = 5 mice per group (2 tumors per mouse)]. ***, P < 0.001 (one-way ANOVA).

