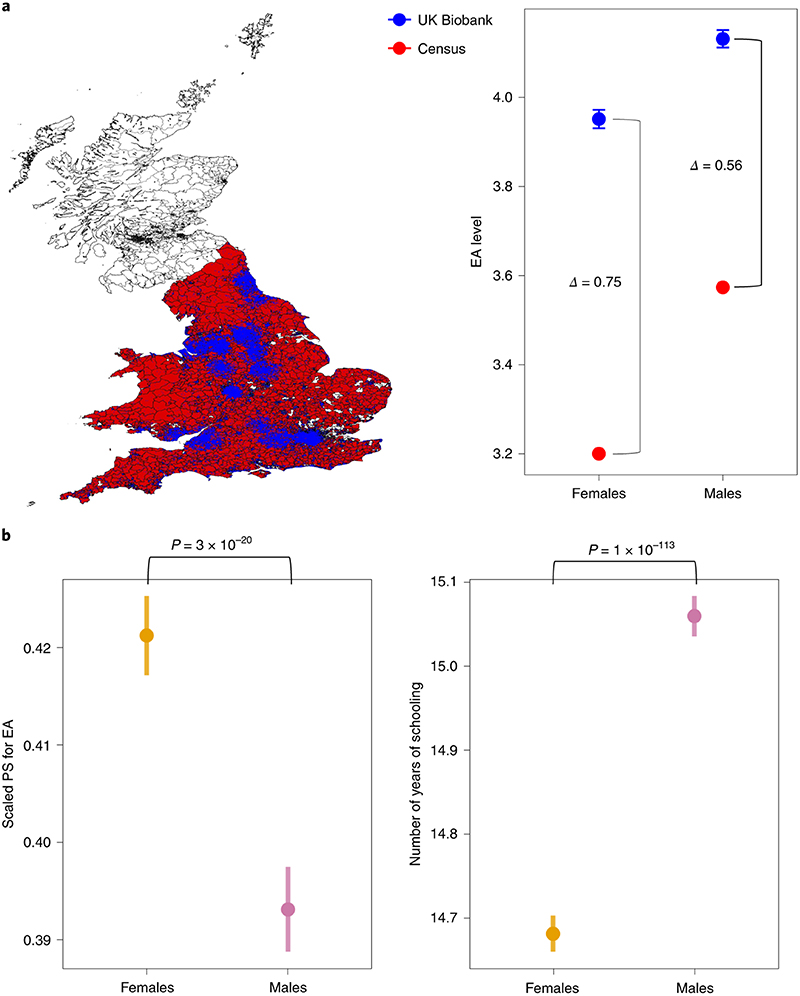
Fig. 5. PS distribution highlights sex-differential participation by educational level in the UK Biobank.
a, Comparing the highest educational level between the 2011 England and Wales census data (red, n = 29,492,209) with the UK Biobank (blue, n = 411,845). We only considered regional census districts with at least one UK Biobank participant. The difference (Δ) in the average educational level between males and females is higher in the general population than in participants in the UK Biobank. The dots represent the mean taking into account the sampling design; the error bars represent the confidence intervals. No confidence intervals were considered for the census data because the entire population was included.
b, PS for EA was significantly higher in females (n = 194,282) compared to males (n = 167,219) in the UK Biobank, whereas the number of years of schooling was higher in males (two-sided t-test). The dots represent the mean value; the error bars represent the s.d.

