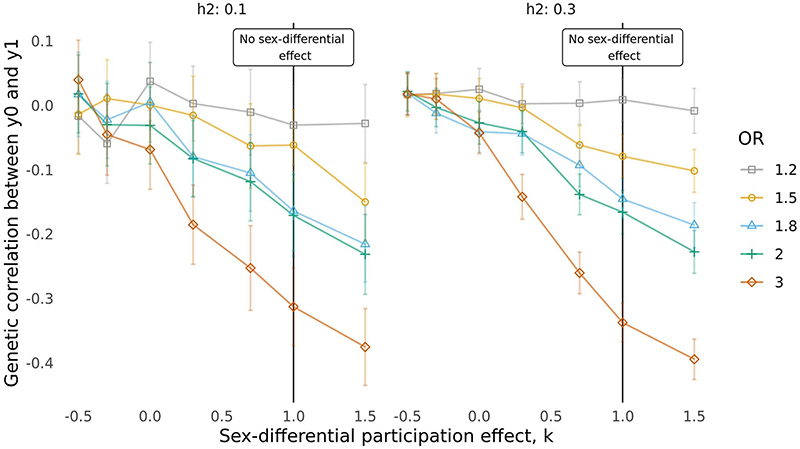
Extended Data Fig. 3. Effect of sex-differential participation bias on the genetic correlation between y0 and y1 when the phenotypes have h2 = 0.1 or h2 = 0.3.
Each line represents a different degree of participation bias, expressed as the odds ratio (OR) used for the sampling. The higher the OR, the higher the degree of participation bias. The x-axis represents different values for the parameter k that gives the sex-differential effect. The smaller k is, the higher is the degree of the sex-differential effect. Under no partecipation bias or sex-differential effect y0 and y1 have a genetic correlation equal to 0.

