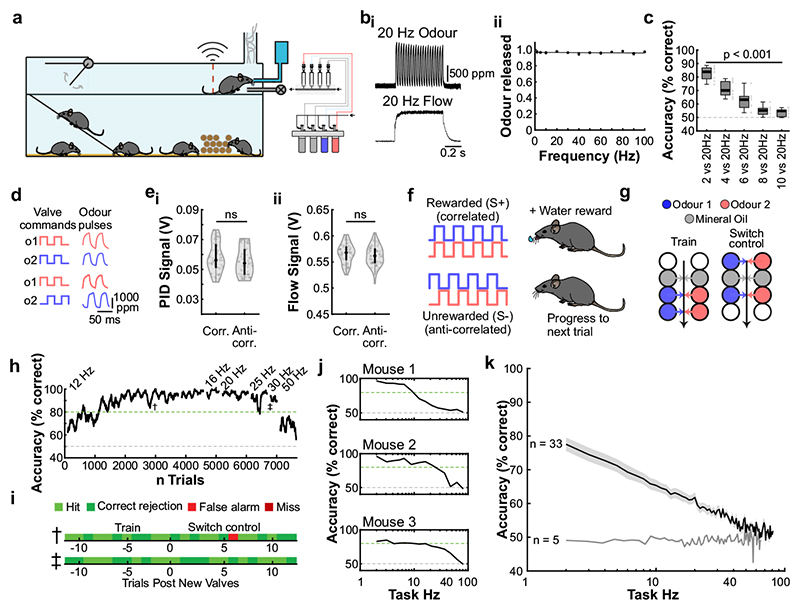
Fig. 2. Mice can discriminate odour correlation structure at frequencies up to 40Hz.
a, Schematic of the automated operant conditioning system (“AutonoMouse”) housing cohorts of up to 25 animals. bi, Representative trace of a 20Hz odour pulse train (top) and corresponding stable airflow (bottom). bii, Relationship of frequency and total amount of odour released (n=5 repeats for each frequency, mean±SEM). c, Group accuracy in frequency discrimination task (n=10 mice, p<0.001 for all stimuli compared to chance accuracy (paired two-sided t-test); see also Extended Data Fig. 3). Boxes indicate 25th-75th percentiles, thick line is median, whiskers are most extreme data points not considered outliers, see Methods. d, Left: Valve commands to release two odours fluctuating at 20 Hz in a correlated (top) or anti-correlated (bottom) manner. Right: Resultant odour concentration changes measured using dual-energy photoionisation detectors (Supplementary Methods Fig. 2). e, Odour (ei) and flow (eii) signal for correlated and anti-correlated stimuli fluctuating at 20Hz (n=60 trials for each condition; odour: p=0.19, flow: p=0.23, unpaired two-sided t-test). Median shown as black dot, first and third quartile are bounds of the black bar. f, Schematic of the discrimination stimuli; mice were trained to discriminate between two odours presented simultaneously in either a correlated (top) or anti-correlated (bottom) fashion in a standard go/no-go paradigm. g, Schematic of valve combinations for stimulus production. Train: 6 valves are used to produce the stimulus through varying valve combinations. Switch control: two extra valves are introduced and odour presentation switched over to the newly introduced valves. h, Example animal performing the correlation discrimination task at different frequencies. i, Trial response maps before and after switch to control valves (as described in g, n=12 trials pre-, n=12 trials post-new valve introduction). Symbols indicate time point of valve introduction as marked in h, see also Extended Data Fig. 4. j, Accuracy of 3 representative animals performing correlation discrimination where stimulus pulse frequency is randomised from trial to trial. k, Group accuracy for the experiment in j (black trace: standard training, band: SEM, grey trace: full scramble control; n=33 training mice, n=5 control mice, n=9.3×10⁵ trials). Throughout, isoamyl acetate and ethyl butyrate were used as odour stimuli.

