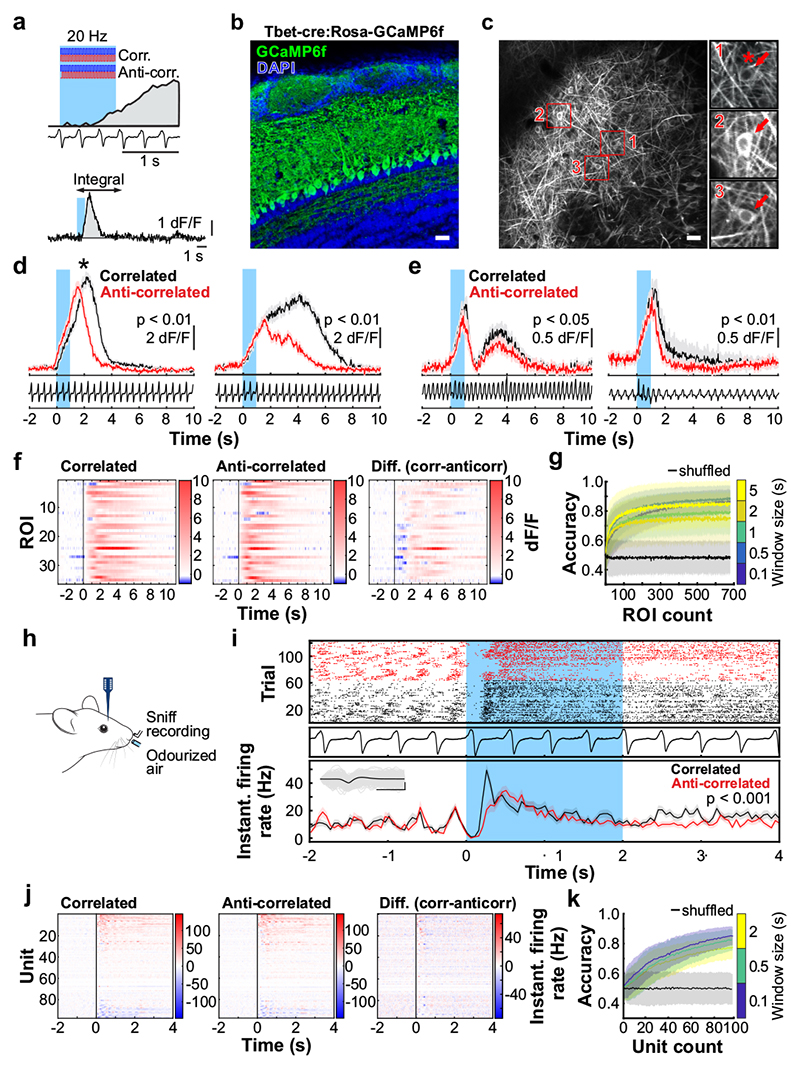
Fig. 3. Odour correlation structure is encoded by olfactory bulb output neurons.
a, Schematic of the two-photon imaging approach (see also Extended Data Fig. 7e). b, Coronal olfactory bulb section showing GCaMP6f (green) expressed in projection neurons. Scale bar: 20μm. c, GCaMP6f fluorescence from mitral and tufted cells (maximum projection of 8000 frames). Responses from ROI * in magnified inset 1 * is shown in d. Scale bar: 20μm. d, Example traces of ROIs that show differential response kinetics to correlated (black) and anti-correlated (red) stimulation (mean of 24 trials±SEM, f=20Hz, unpaired two-sided t-tests on 5s response-integrals) in anaesthetised and e, awake animals (mean of 16 trials±SEM, f=20Hz, unpaired two-sided t-tests). Odour presentation indicated in light blue. f, Calcium transients as colour maps for correlated (left) anti-correlated (middle) averaged trials and the difference between both odour stimulations (right) for the 5% of ROIs with the largest differential responses. g, Accuracy of linear classifier trained on several response windows (colour-coded, black: shuffle control) to correlated vs. anti-correlated stimuli at 20Hz (n=up to 680 ROIs from 6 individual animals; mean±SD of 500 repetitions). h, Schematic of the extracellular recording approach. i, Example single unit of an odour response for correlated (black) and anti-correlated (red) stimuli shown as raster plot (top) and PSTH (mean±SEM) of spike times binned every 50ms (bottom); inset: average spike waveform (black) and 1000 individual spike events (grey), scale bar: 100μV and 1ms. Odour presentation indicated in light blue. Two-sided Mann-Whitney U test comparing spike time distributions of correlated and anti-correlated trials during 4s after odour onset. j, Binned spike discharge over time shown as colour maps for all units, correlated (left), anti-correlated (middle) and the difference between both odour stimulations (right). k, Accuracy of linear classifier trained on the average 2s response to correlated vs. anti-correlated stimuli at 20Hz (yellow); green: 500ms window; blue 100ms window (n=up to 97 units from 6 individual animals; mean±SD of 1000 classifier repetitions; see Methods and Extended Data Fig. 8).

