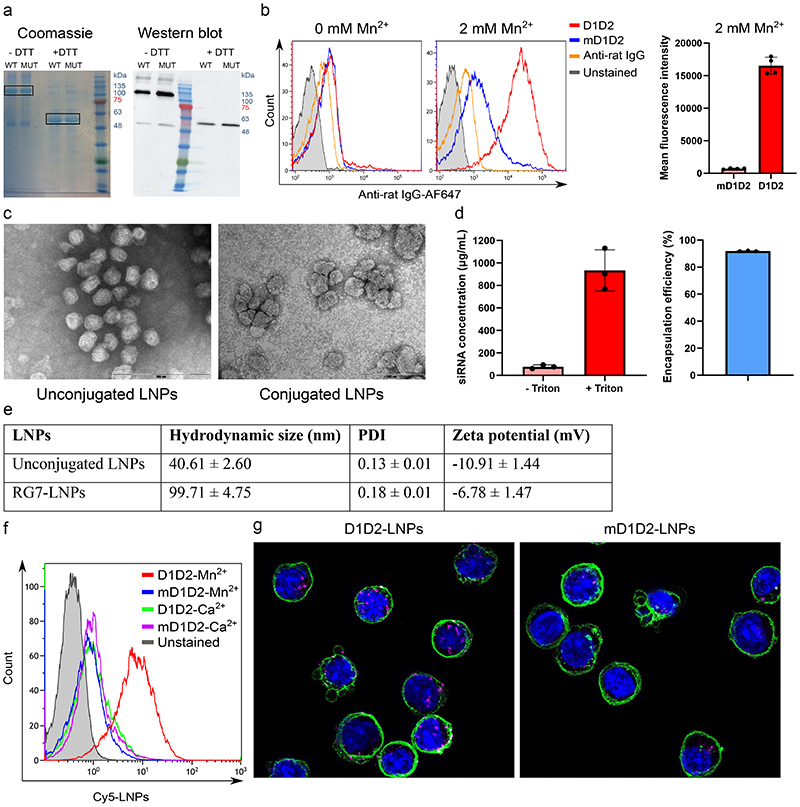
Figure 2. Characterization of D1D2, LNPs and D1D2-targeted LNPs.
a. SDS PAGE of both the D1D2 (WT) and mD1D2 (MUT) proteins. Dimerization through disulfide bonds is evident when comparing to the lanes without reducing agent. Experiment was repeated 3 times independently. b. In vitro binding of the purified D1D2 protein to TK-1 cells measured by flow cytometry. mD1D2 does not bind the cells while the D1D2 binds only cells with HA integrin α4β7 (after addition of Mn2+). A significant difference between D1D2 and mD1D2 in Mn2+-activated cells was observed (p < 0.0001, n = 4 biologically independent samples, two-sided student’s t-test, data are presented as mean +/- SD). c. Representative transmission electron microscopy images of unconjugated LNPs and LNPs conjugated to RG7. Experiment was repeated 3 times independently. d. siRNA entrapment efficiency assayed by Ribogreen, n = 3 biologically independent samples. Data presented as mean +/- SD. e. Hydrodynamic size, polydispersity index (PDI) and zeta potential of the produced LNPs. f. In vitro binding of Cy5-labeled, D1D2-targeted LNPs to TK1 cells. g. Representative confocal images showing internalization of Cy5-labeled LNPs (magenta) into TK-1 cells. Images were generated by combining 11 frames from Z-stack imaging (0.3 μm/frame).

