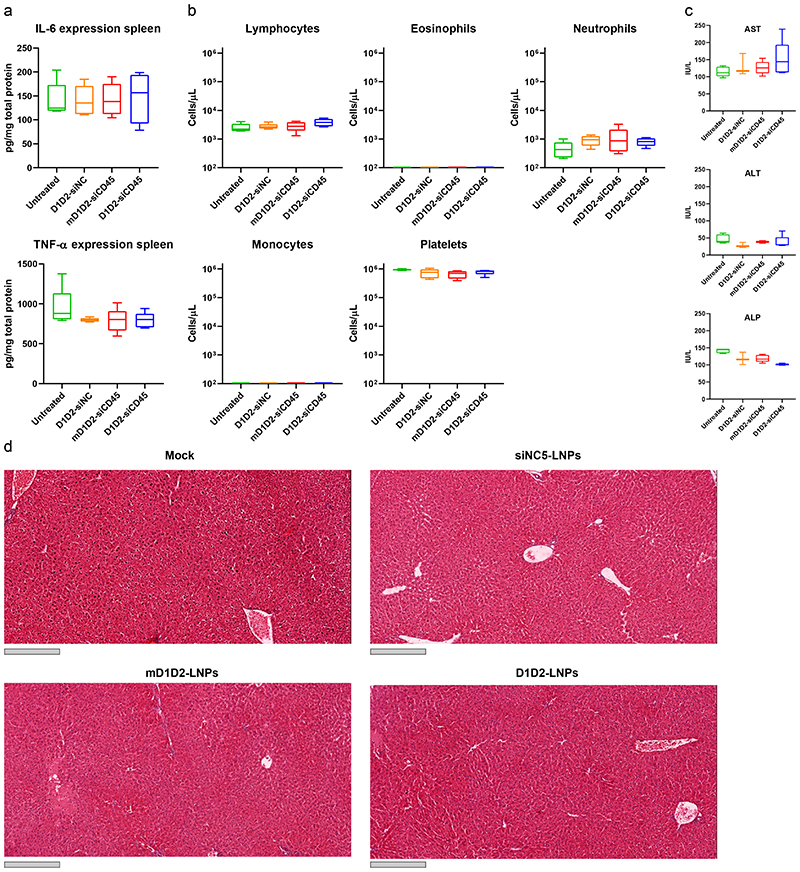
Figure 5. Safety profile of different LNP formulations.
Safety was determined by measuring both liver toxicity and immune activation. a. Splenic expression levels of the pro-inflammatory cytokines TNF-α and IL-6. b. Complete blood count. c. Serum levels of liver enzymes. d. Histology of the liver. Grey scale bar represents 300 μm. The liver was sectioned, and H&E stained. No significant elevation of cytokines, liver enzymes and blood count was detected in the LNP-treated mice compared to the untreated (one-way ANOVA with Dunnett’s test comparing each group to the untreated mice, n = 5). Liver histology did not reveal tissue damage or excessive bleeding in any of the treated groups. Box plots in a-c: minimum = lowest value, maximum = highest value, center = median, bounds of box = interquartile range, lower whisker = lowest value till 25th percentile, upper whisker = 76th percentile till highest value. Experiment was repeated 3 times independently.

