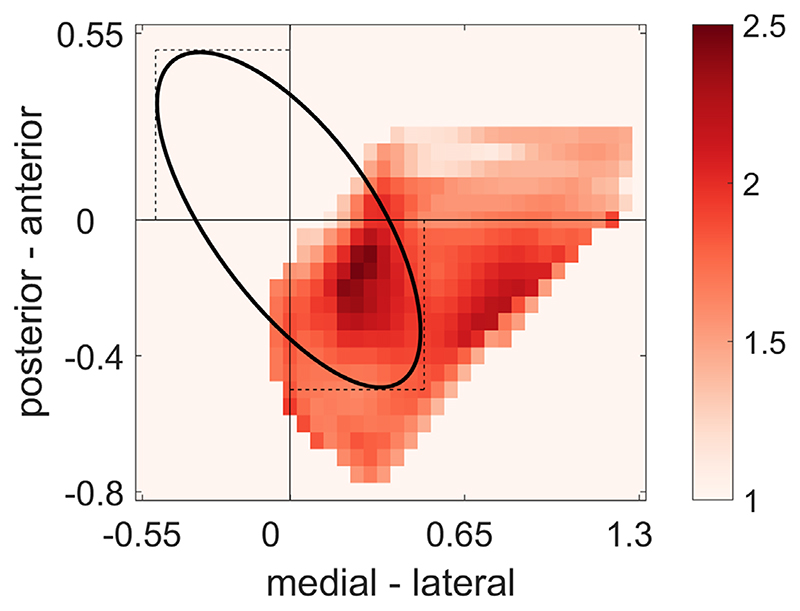
Fig. 3.
Distribution of α power. Power averaged across contact positions normalized relative to the STN poles (anterior pole: x = –0.5, y = 0.5; posterior pole: x = 0.5, y = –0.5), reducing the between-subjects variability because of differently sized subhalamic nuclei. Distances are relative to the STN centroid located at [0, 0], where the horizontal and vertical lines cross. The black ovoid represents the dimensions of the idealized STN. Note that contacts were positioned such that not all of the STN was covered. [Color figure can be viewed at wileyonlinelibrary.com]

