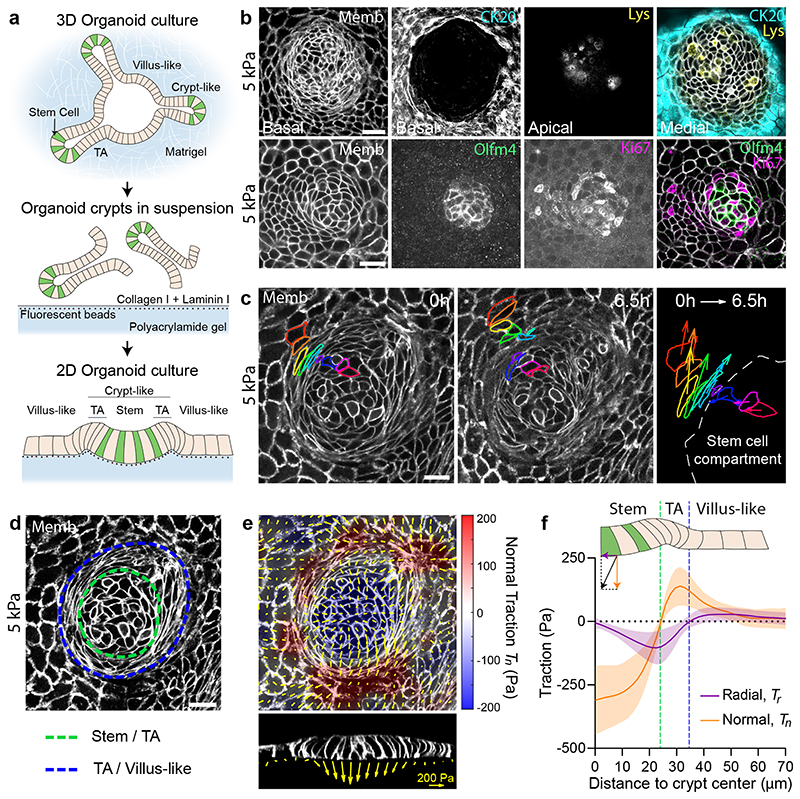
Fig. 1. Tractions exerted by intestinal organoids define mechanical compartments.
a, Preparation of mouse intestinal organoids on 2D soft substrates. b, Organoids expressing membrane targeted tdTomato (Memb, basal plane) stained for cytokeratin 20 (CK20, basal plane), Lysozyme (Lys, apical plane), Olfm4 (basal plane) and Ki67 (basal plane). Scale bar, 20 μm. Images are representative of 3 independent experiments. c, Displacements of representative cells over 6.5h. Each color labels one cell. Note that one cell divided (green). Right: displacement vector of each cell. Scale bar, 20 μm. See also Supplementary Video 3. Representative of 3 independent experiments. d, Illustration of the boundaries between the stem cell compartment and the transit amplifying zone (green) and between the transit amplifying zone and the villus-like domain (blue). Scale bar, 20 μm. e, Top: 3D traction maps overlaid on a top view of an organoid. Yellow vectors represent components tangential to the substrate and the color map represents the component normal to the substrate. Bottom: lateral view along the crypt horizontal midline. Yellow vectors represent tractions. Scale vector, 200 Pa. Representative of 7 independent experiments. f, Circumferentially averaged normal tractions Tn (orange) and radial tractions Tr (purple) as a function of the distance to the crypt center. Blue and green dashed lines indicate the radii where Tn and Tr are zero, which closely correspond to the boundaries between functional compartments illustrated in d. Radial traction at villus is significantly different from 0 (One-Sample Wilcoxon test, p<0.0001). Data are represented as mean ± SD of n=37 crypts from 7 independent experiments.

