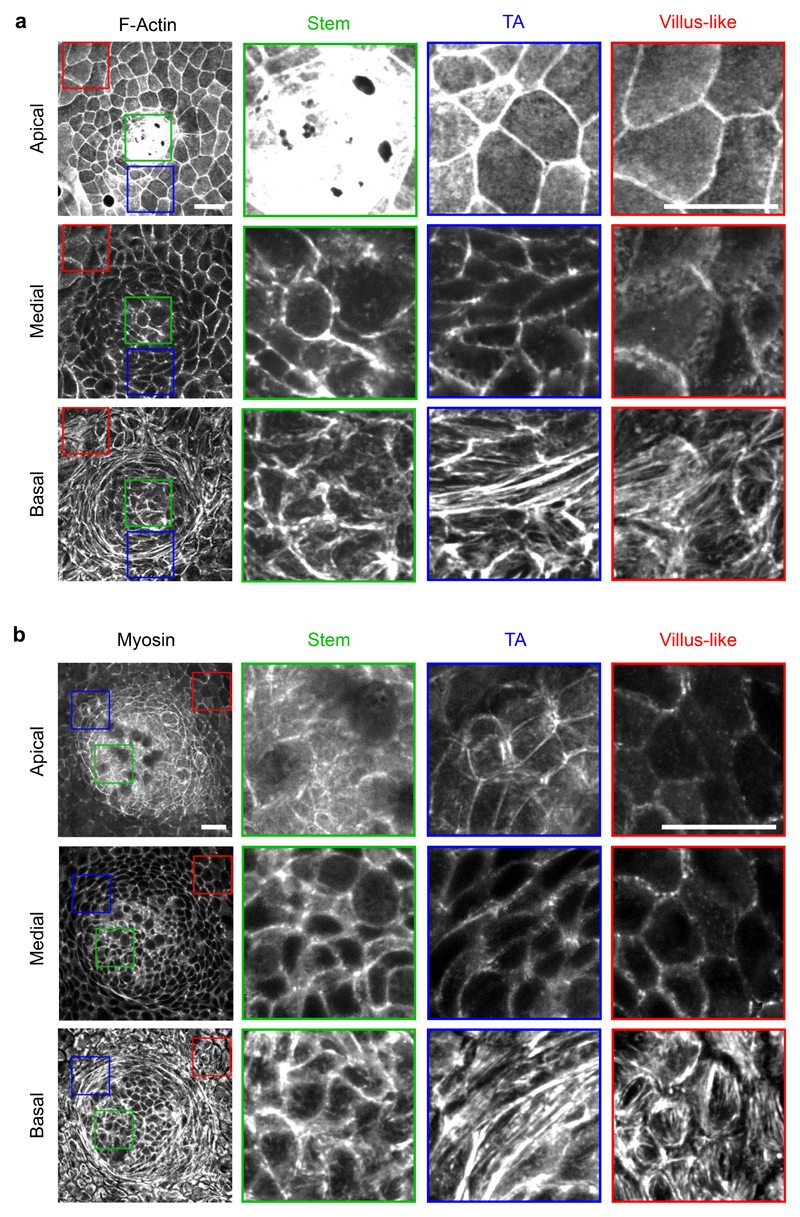
Extended Data Fig. 3. Apicobasal distribution of F-actin and Myosin in organoid monolayers.
a-b, Apical, medial and basal projections of F-Actin (Phalloidin, a) and myosin IIA-eGFP (b). The stem cell compartment (Stem), the Transit amplifying zone (TA) and the villus-like domain (villus-like) are zoomed in the regions of the monolayer indicated with the respective colors. Representative images from 4 (a) and 2 (b) independent experiments. Scale bars, 20 μm. Stiffness of the gel, 5kPa.

